Application Overview
The Application Overview page summarizes activity at the application layer (Layer 7), such as web, DNS, TLS, database, and authentication traffic. Data is aggregated in 5-minute intervals.
Menu: Applications › Overview
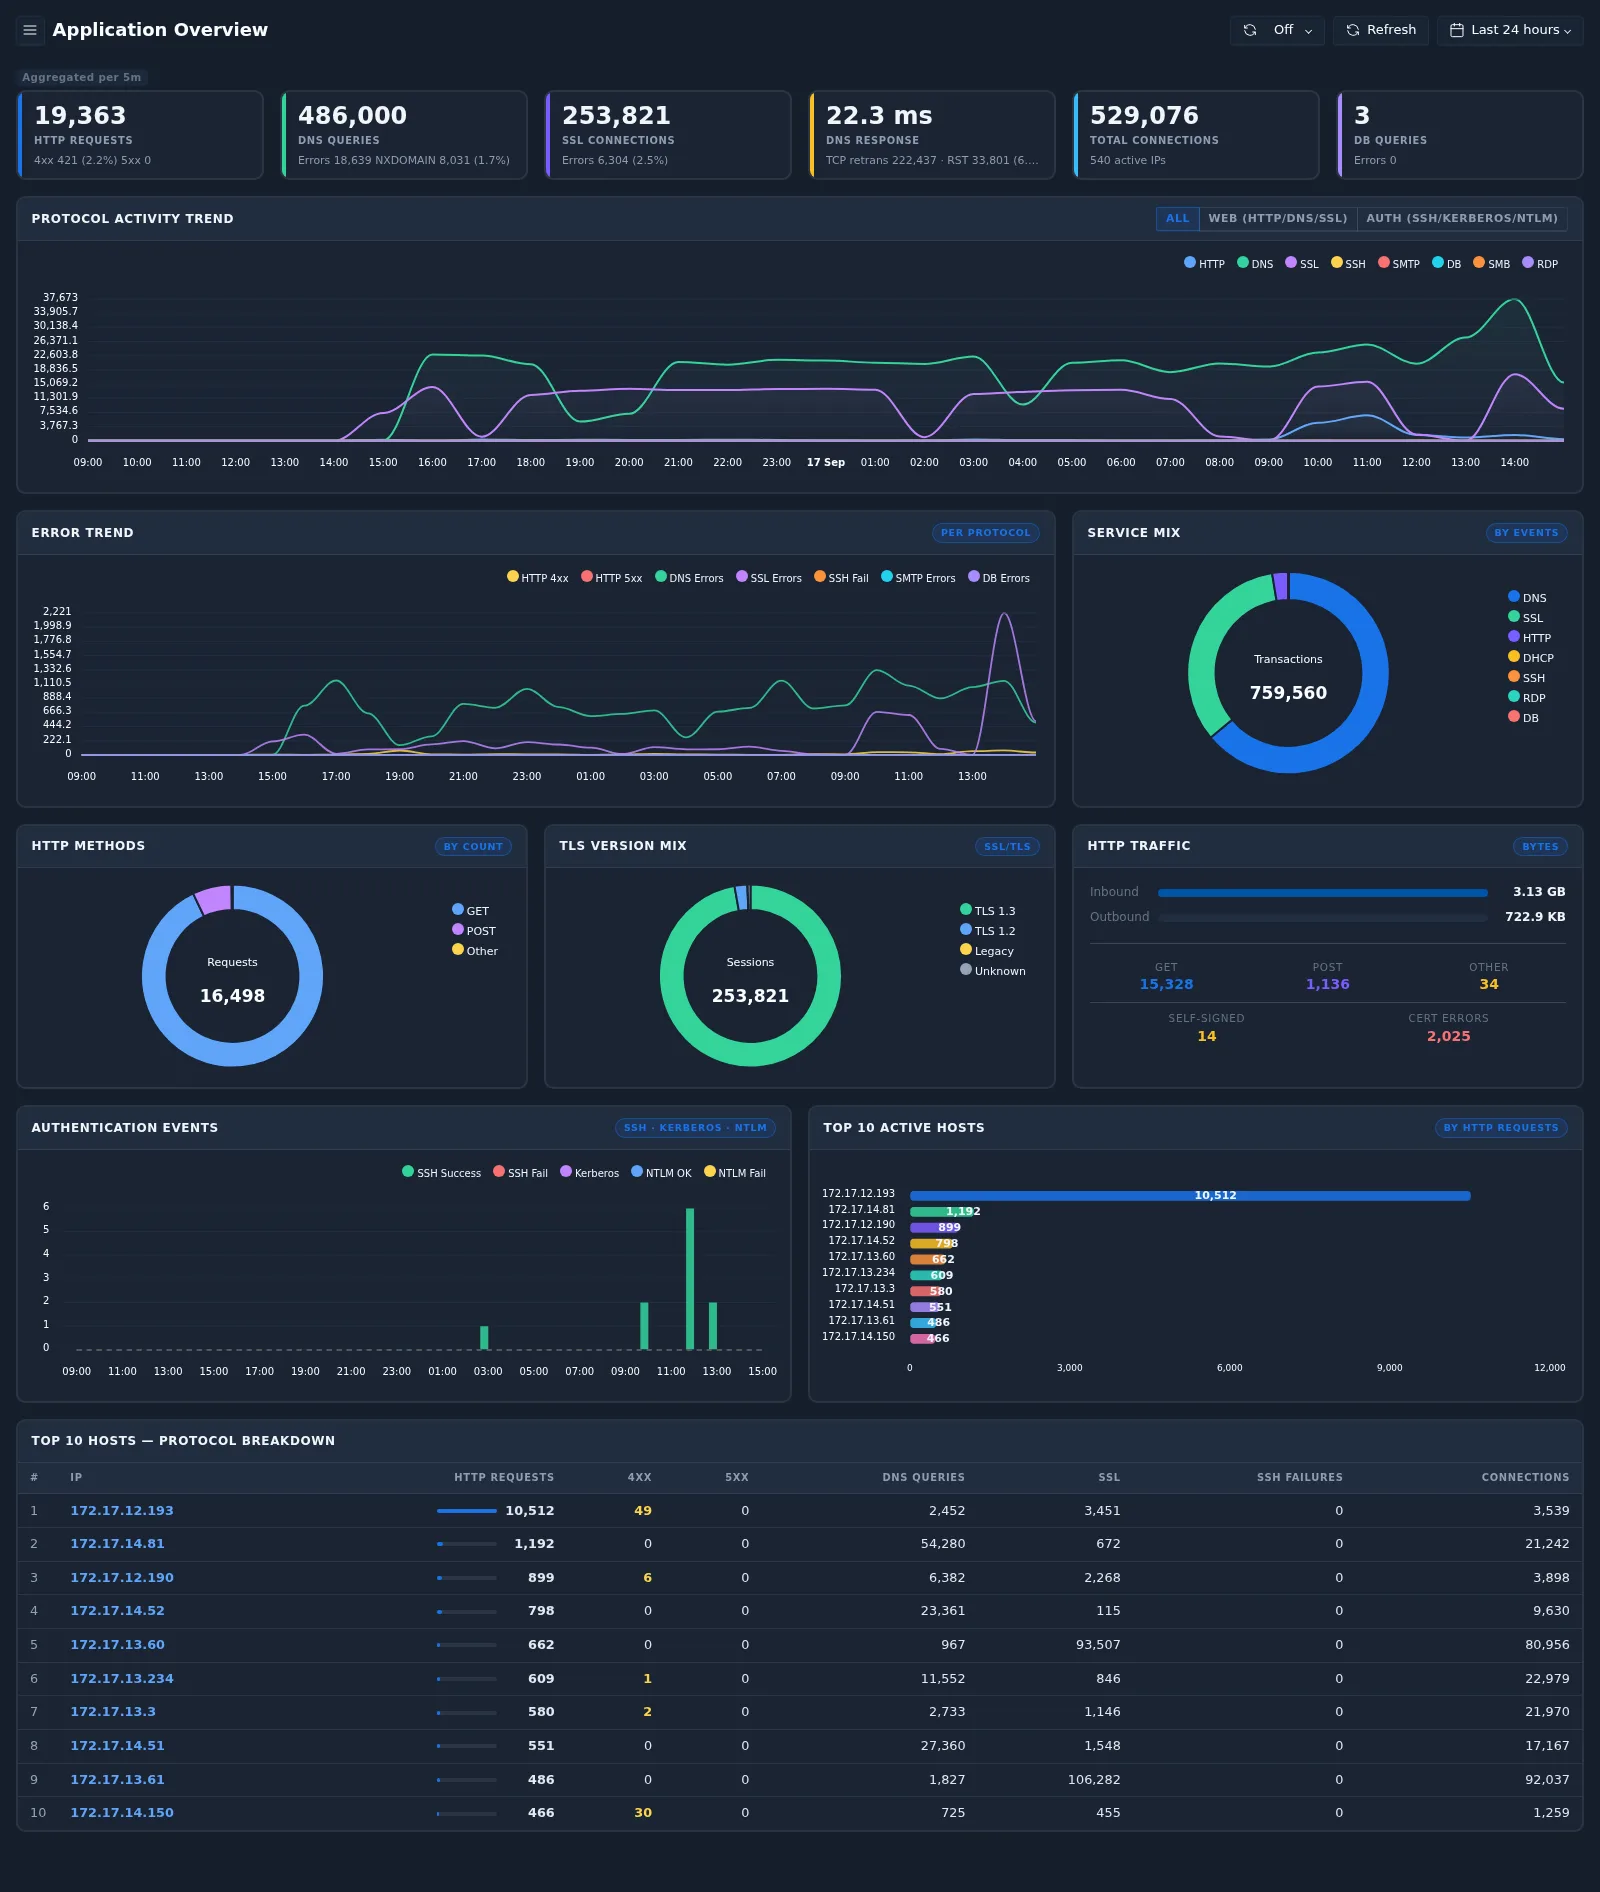
Summary cards
| Card | Shows | Drill-down |
|---|---|---|
| HTTP Requests | Number of HTTP requests, with 4xx and 5xx error counts | HTTP Requests by host |
| DNS Queries | Number of DNS queries, with errors and NXDOMAIN | DNS Queries by host |
| SSL Connections | Number of SSL/TLS connections, with errors | SSL/TLS Connections by host |
| DNS Response | Average DNS response time, with TCP retransmissions and resets | — |
| Total Connections | Total connections and number of active IPs | Total Connections by host |
| DB Queries | Number of database queries, with errors | DB Queries by host |
Panels
| Panel | How to read it |
|---|---|
| Protocol Activity Trend | Activity per protocol over time. Filter by All, Web (HTTP/DNS/SSL), or Auth (SSH/Kerberos/NTLM) |
| Error Trend | Errors per protocol over time: HTTP 4xx/5xx, DNS, SSL, SSH failures, SMTP, and database errors |
| Service Mix | Share of transactions by service (for example DNS, SSL, HTTP, DHCP, SSH, RDP, DB) |
| HTTP Methods | Share of GET, POST, and other methods |
| TLS Version Mix | Share of TLS 1.3, TLS 1.2, legacy, and unknown versions. Legacy versions may indicate outdated clients or servers |
| HTTP Traffic | Inbound and outbound HTTP bytes, request methods, self-signed certificates, and certificate errors |
| Authentication Events | SSH success/failure, Kerberos, and NTLM success/failure over time. Bursts of failures may indicate brute-force attempts |
| Top 10 Active Hosts | Hosts with the most HTTP requests |
| Top 10 Hosts — Protocol Breakdown | Per host: HTTP requests, 4xx, 5xx, DNS queries, SSL, SSH failures, and connections |
Select an IP address in the host tables to open its asset profile.
Protocol drill-down pages
Selecting a summary card opens a ranked table of hosts for that protocol.
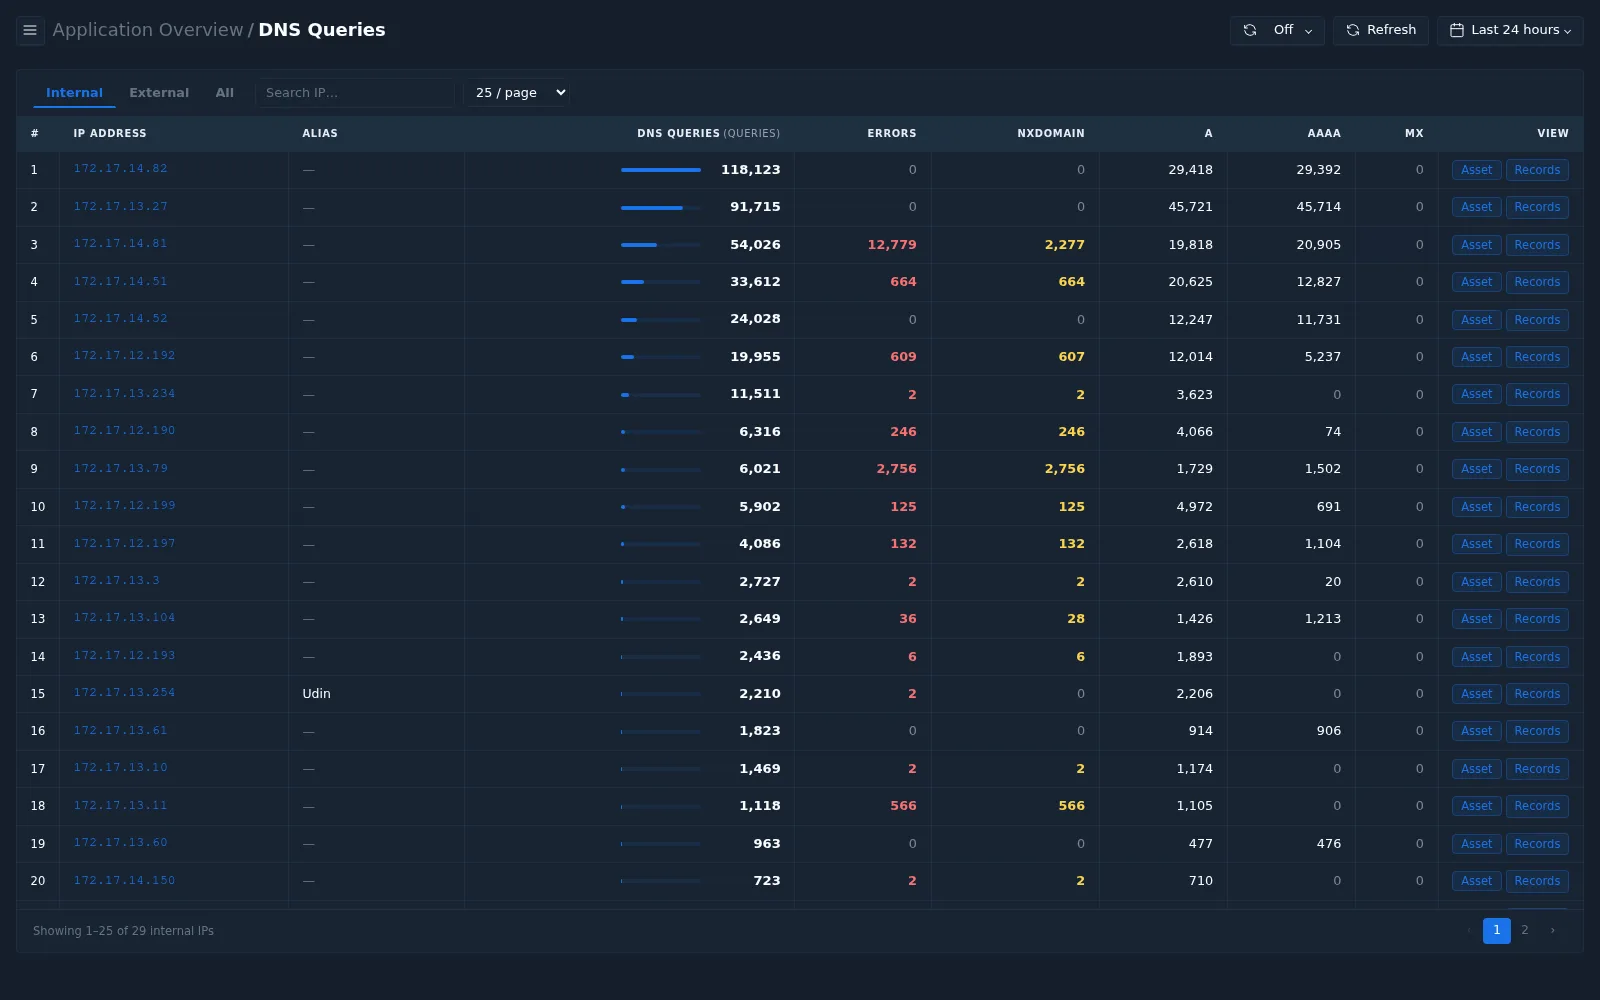
| Drill-down | Columns |
|---|---|
| HTTP Requests | Requests, 4xx, 5xx, GET, POST, in, out |
| DNS Queries | Queries, errors, NXDOMAIN, A, AAAA, MX |
| SSL/TLS Connections | Connections, errors, certificate errors, self-signed, TLS 1.3, TLS 1.2, legacy |
| Total Connections | Connections, internal, external, in, out |
| DB Queries | Queries, errors, success |
| SMTP Messages | Messages, errors, connections |
As on the network drill-down pages, you can filter by Internal, External, or All, change rows per page, and open Asset or Records for each host.