Detection Details and Investigation
The detection detail page contains everything needed to understand a detection and decide what to do about it. Open it by selecting a detection in Detections or the Security Overview.
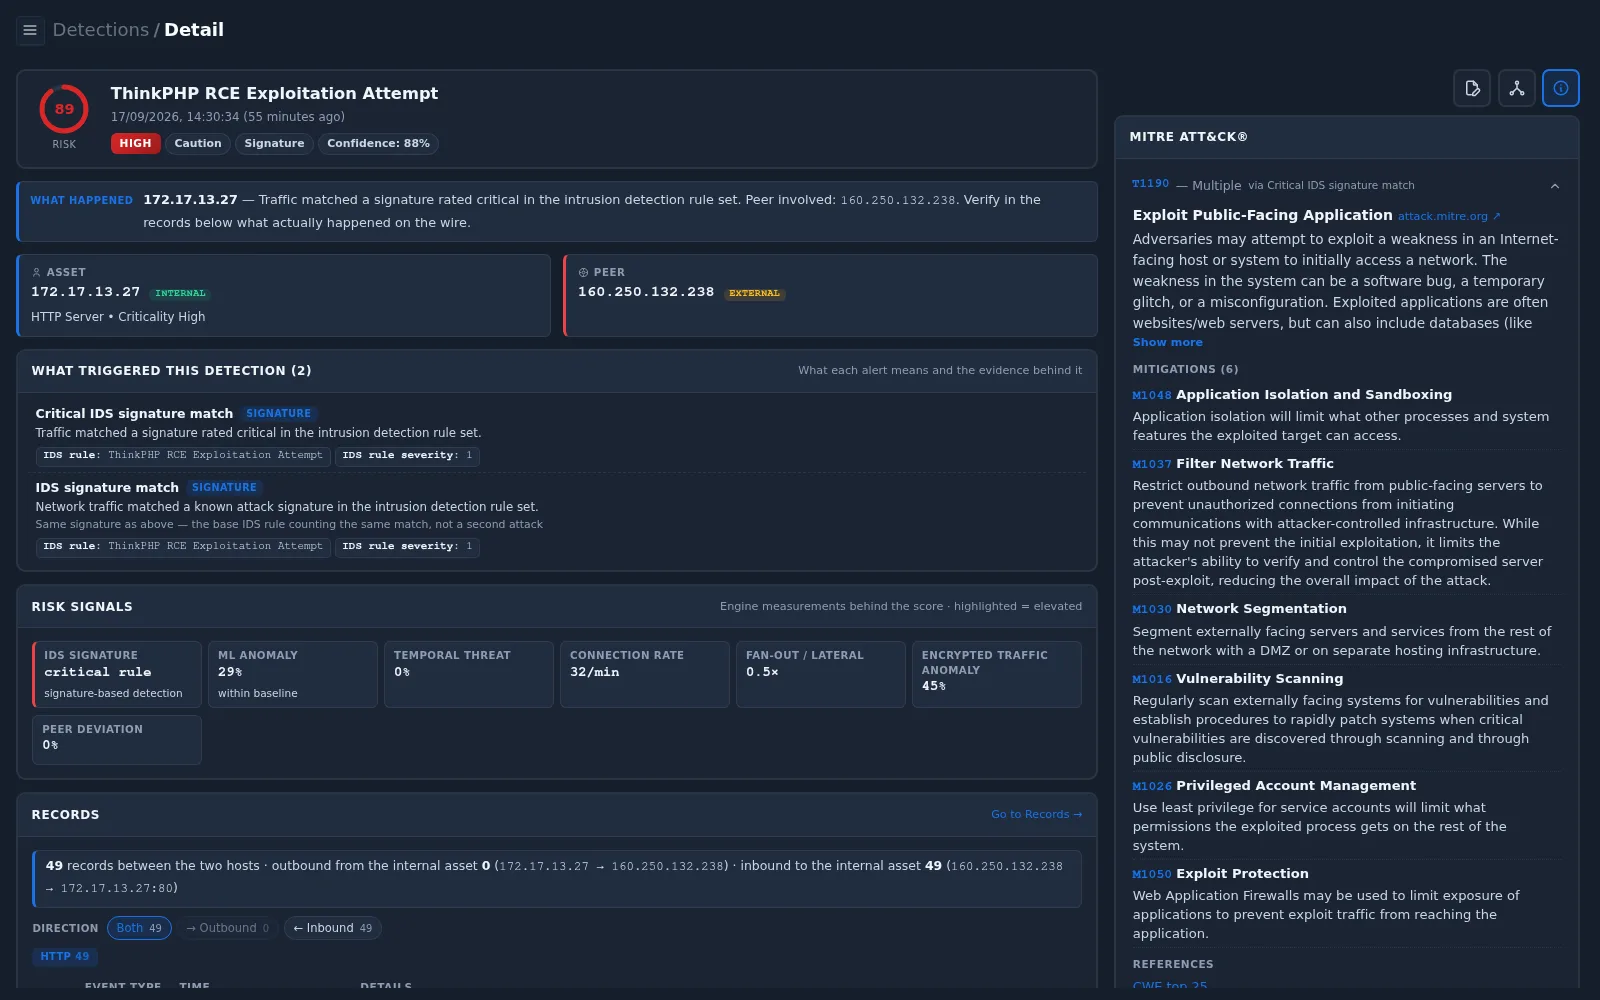
Page layout
| Section | Description |
|---|---|
| Header | Risk score, detection name, time, severity, category, detection method (Signature or Behaviour), and confidence |
| What Happened | Plain-language summary of the detection and the hosts involved |
| Asset | The internal host: IP address, role (for example HTTP Server), and criticality |
| Peer | The remote host: IP address, internal/external, and port |
| What Triggered This Detection | Each alert behind the detection, what it means, and its evidence |
| Risk Signals | Engine measurements that contributed to the risk score |
| Records | The network records between the asset and the peer around the detection time |
| Side panels | Detection Tracking, Participant & History, and MITRE ATT&CK |
What Triggered This Detection
A detection can combine several alerts. For each alert the page shows:
- The alert name and its type (SIGNATURE or BEHAVIOUR)
- A description of what the alert means
- The evidence values, such as the IDS rule name and severity, bytes sent, number of connections, or a score
If two alerts describe the same underlying match, the page says so — for example Same signature as above — the base IDS rule counting the same match, not a second attack.
Risk signals
Risk signals are the measurements behind the risk score. Signals that are highlighted are elevated for this detection.
| Signal | What it measures |
|---|---|
| IDS Signature | Whether traffic matched an intrusion detection signature, and its rule level |
| ML Anomaly | How anomalous the activity is according to machine learning, or within baseline |
| Temporal Threat | Suspicious timing patterns in the activity |
| Connection Rate | Connections per minute, with a rate spike indicator |
| Beaconing | Regular, repeated connections to the same destination — confirmed when detected |
| Fan-out / Lateral | How widely the asset communicates compared with normal |
| Encrypted Traffic Anomaly | Anomalies in encrypted (TLS) traffic characteristics |
| Peer Deviation | How unusual the peer is for this asset |
| NXDOMAIN Ratio | Share of DNS lookups that returned non-existent domain (shown when relevant) |
See Detection Reference for the full list of signals, categories, and detection methods.
Records
The Records section shows the actual network records between the asset and the peer within ±30 minutes of the detection window. Use it to verify what happened on the wire.
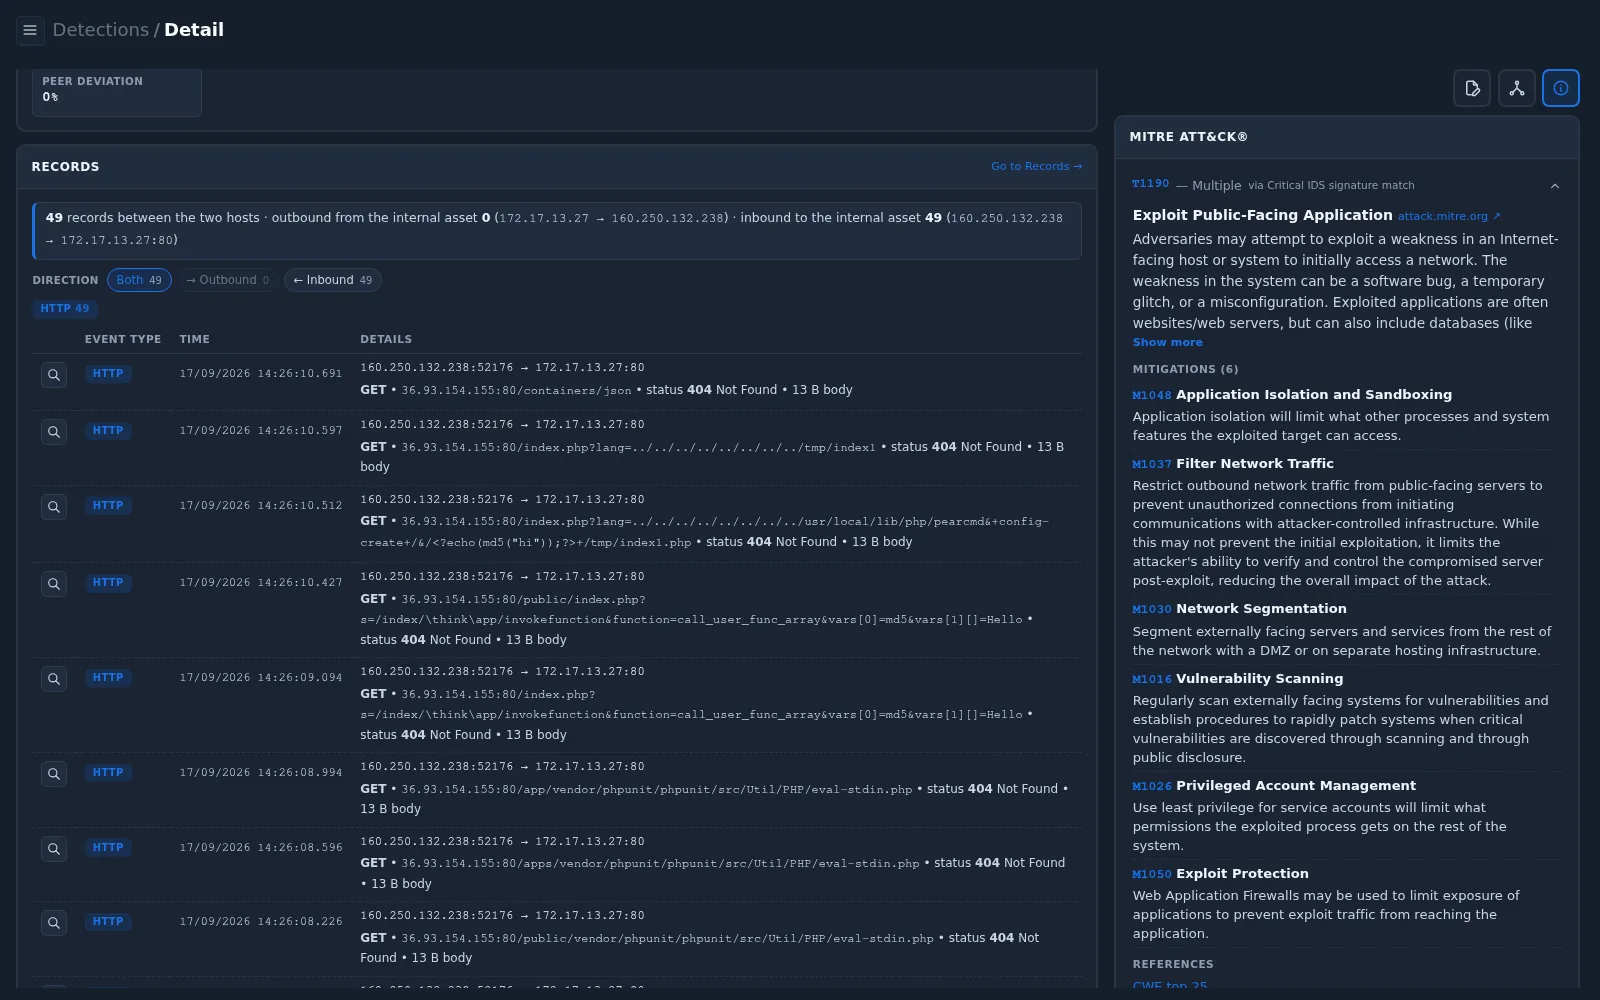
- The summary states how many records are outbound from and inbound to the internal asset.
- Filter by Direction: Both, Outbound, or Inbound.
- Filter by event type using the chips (for example HTTP, SSL, CONN).
- Each row shows the event type, time, and details such as addresses and ports, HTTP method and URL with response status, TLS server name (SNI) and version, or bytes sent and received.
- Select the magnifier icon to inspect a record, or Go to Records → to open the full Records search.
Side panels
Use the three buttons in the top-right corner of the page to switch between side panels.
Detection Tracking
Records the handling of the detection.
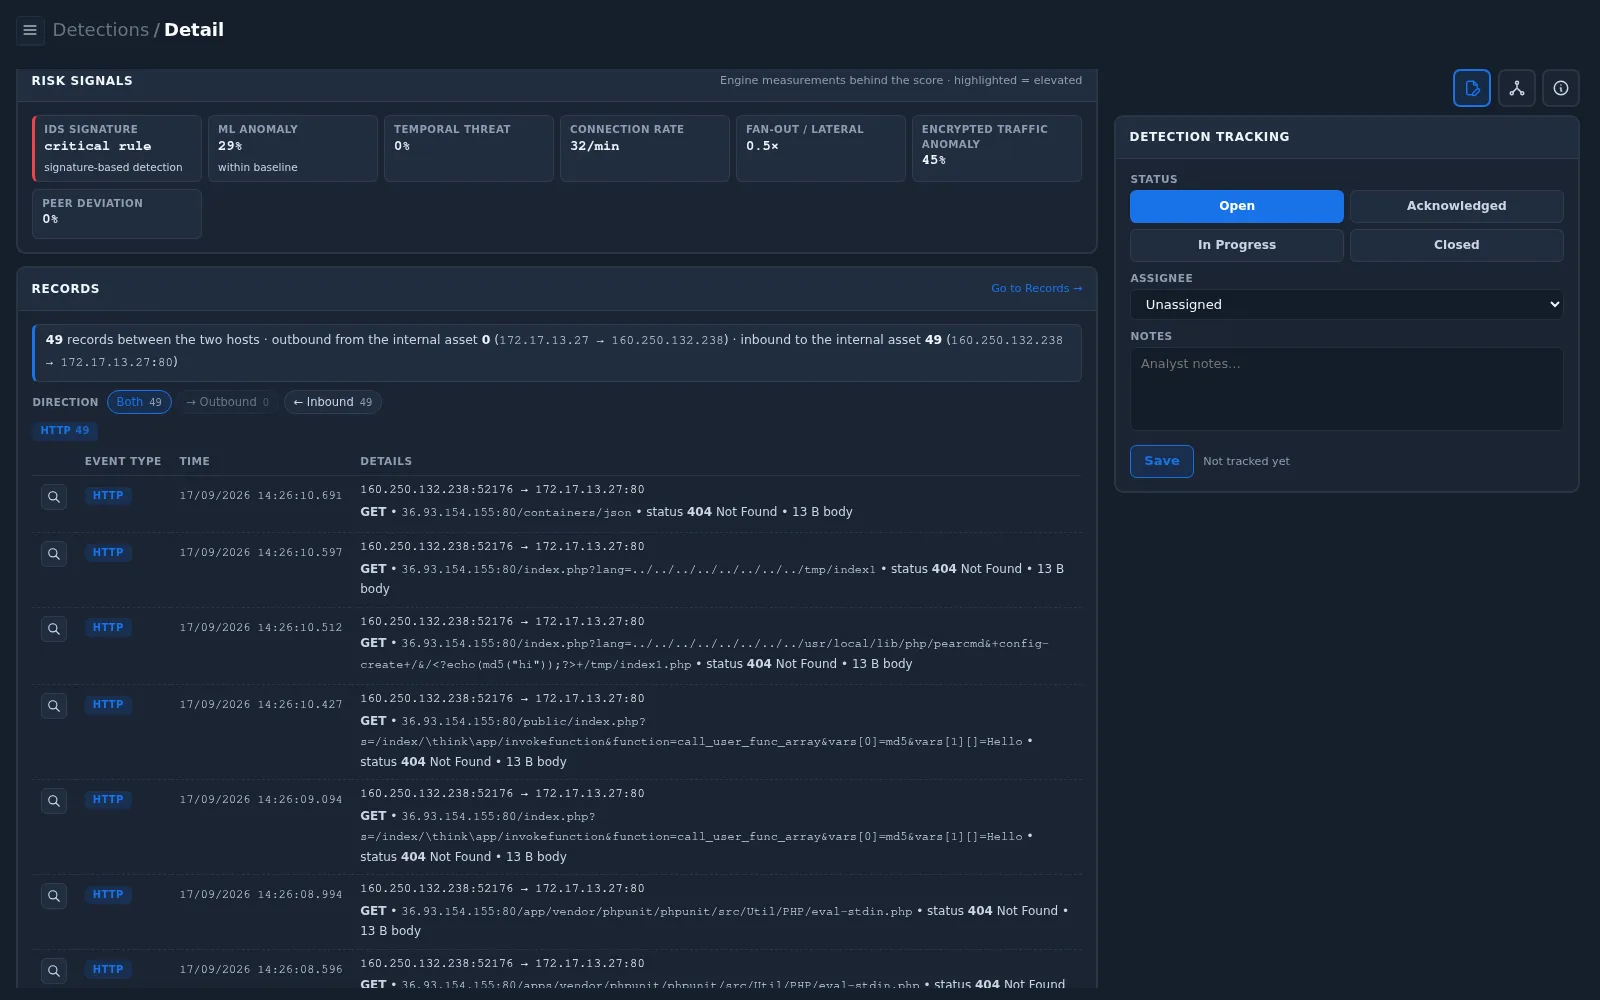
| Field | Description |
|---|---|
| Status | Open, Acknowledged, In Progress, or Closed |
| Assignee | Unassigned or a user (use Me to assign the detection to yourself) |
| Notes | Analyst notes about the investigation and decision |
Select Save to store the changes. Tracking status is reflected in the Detections filters and the Detection Tracking panel on the Security Overview.
Participant & History
Shows the profile of the Asset or Peer (switch using the tabs) and other detections involving the same IP address in the selected range.
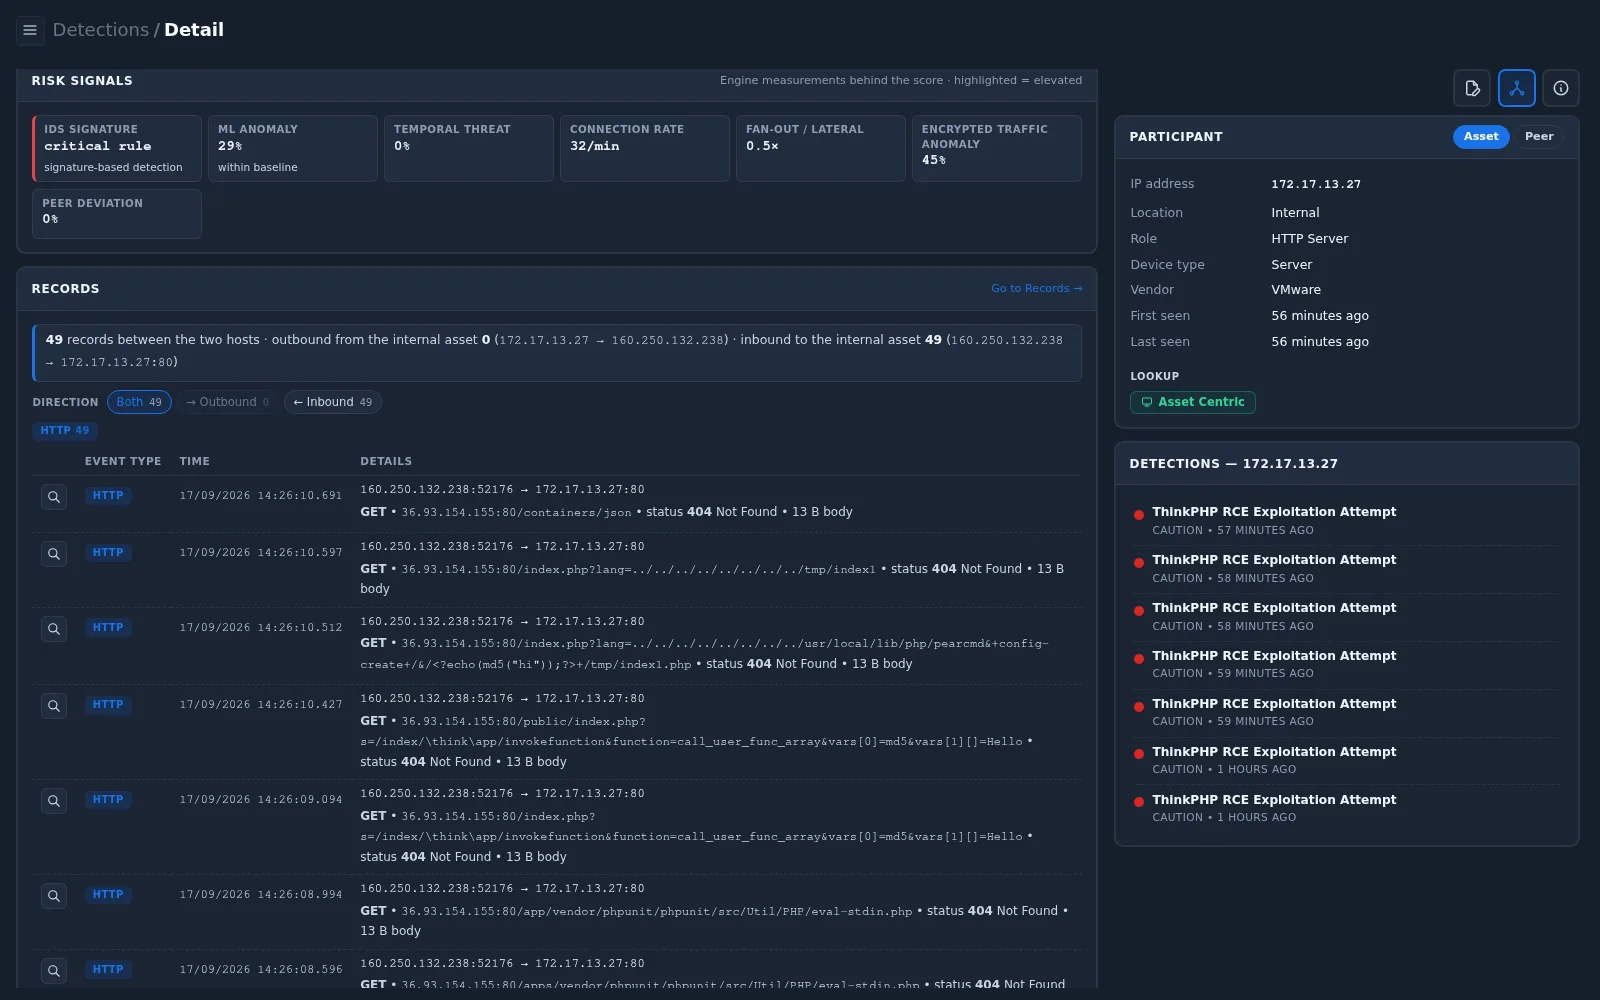
- For an internal asset: location, role, device type, vendor, first and last seen, and an Asset Centric link to the asset profile.
- For an external peer: first and last seen, and Lookup links to VirusTotal, AbuseIPDB, and ARIN Whois for external reputation and ownership checks.
MITRE ATT&CK
Shows the MITRE ATT&CK technique mapped to each alert, its description, the recommended Mitigations, and References. The mitigations are the recommended follow-up actions for this type of activity.
Investigation workflow
The detail page supports the incident response flow described in Incident Response.
- Review — read What Happened, the asset and peer, and what triggered the detection.
- Verify — check the records to confirm what actually happened, and check the participant history and external lookups.
- Decide — use the risk signals, asset criticality, and MITRE ATT&CK mitigations to decide whether the detection is a real threat and which action is appropriate.
- Act and record — set the status to Acknowledged or In Progress, assign an owner, document the decision and actions in Notes, and set the status to Closed when finished.
If a detection is confirmed to be expected behaviour, consider a suppression rule in Settings › Detection Tuning to avoid repeated alerts.