Detections
The Detections page is the main workspace for reviewing and handling detections. It provides four views of the same detections.
Menu: Security › Detections
Filters and sorting
The filter bar applies to all views.
| Filter | Options |
|---|---|
| Filter by IP/CIDR | An IP address or network range, for example 172.16.0.0/16 |
| Severity | All Severities, High, Medium, Low |
| Status | All Statuses, Open, Acknowledged, In Progress, Closed |
| Assignee | All Assignees, Unassigned, Assigned to Me |
| Category | All Categories, C2, UEBA, Caution, Exfiltration, Discovery |
| Sort | Newest First, Oldest First, Highest Risk, Lowest Risk |
Categories
| Category | Activity |
|---|---|
| C2 | Communication with an external controller, or unexpected egress |
| UEBA | Behaviour that deviates from the host's normal baseline |
| Caution | Traffic matching known attack signatures |
| Exfiltration | Data leaving the network in unusual ways |
| Discovery | Reconnaissance, such as port scanning |
See Detection Reference for examples, detection methods, and statuses.
Triage
Triage lists unique combinations of category, asset, and peer, ordered by highest risk first. Repeated occurrences of the same activity are combined into one item, so the list shows what needs attention rather than every event.
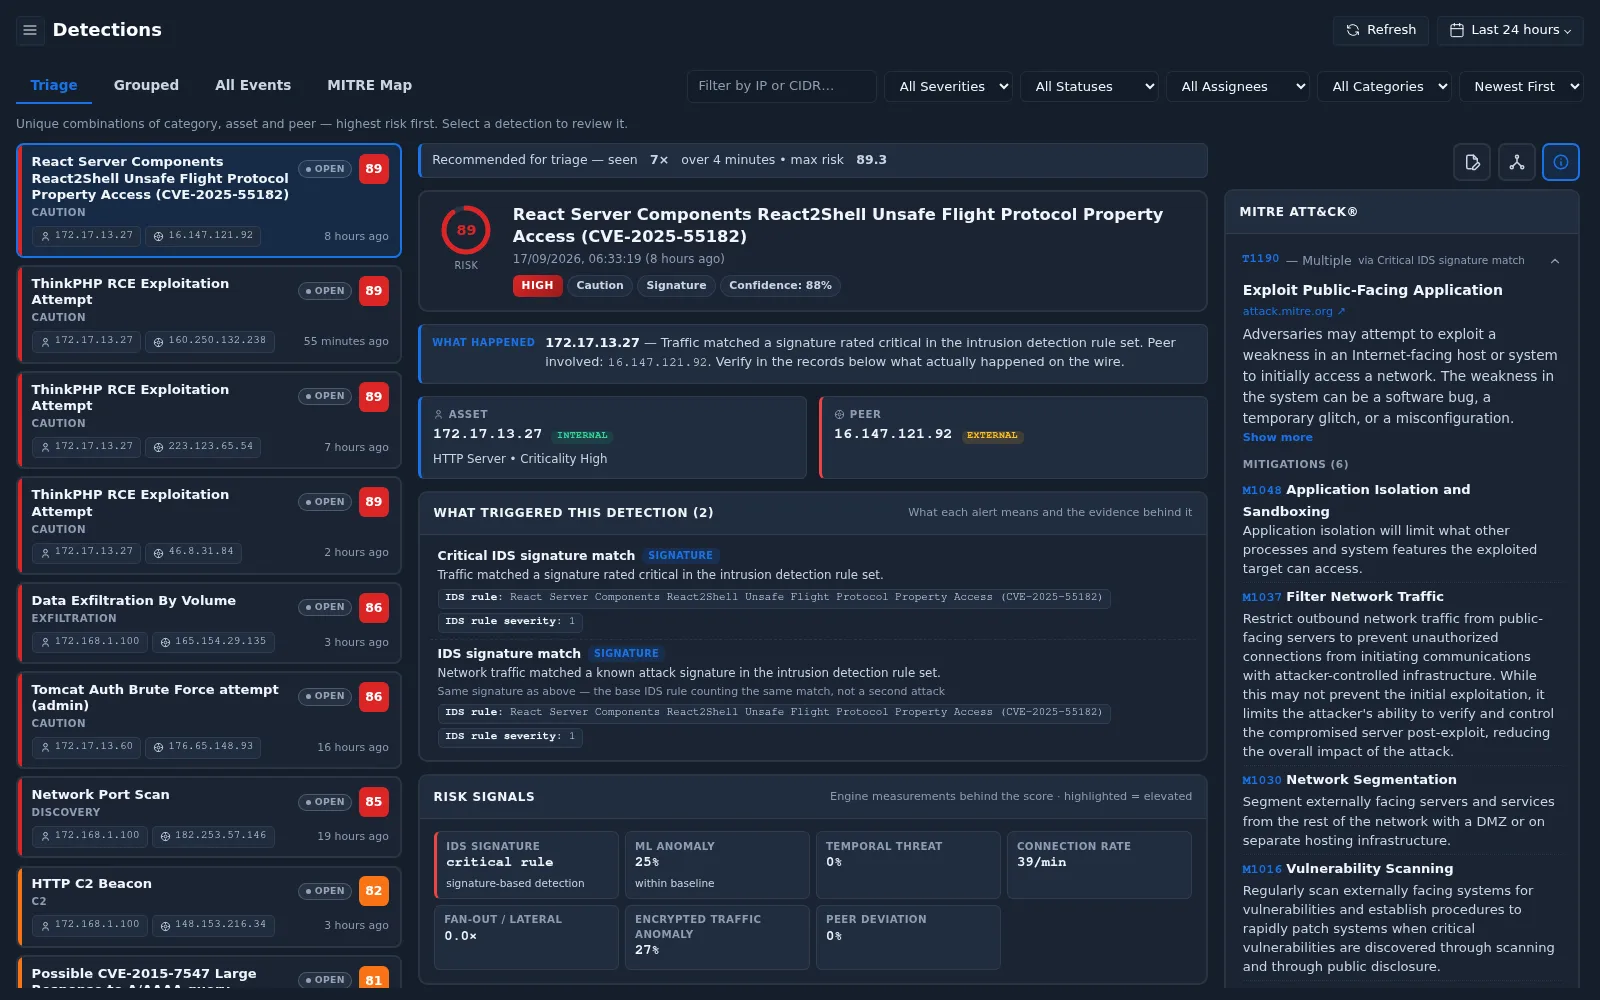
Each item in the list shows:
- Detection name and category
- Tracking status (for example OPEN) and risk score
- Asset (internal IP) and peer (remote IP)
- Time since the detection was last seen
Select an item to review it in the panel on the right. The panel shows the same information as the detection detail page, including a summary such as Recommended for triage — seen 7× over 4 minutes • max risk 89.3.
Grouped
Grouped aggregates detections so you can see which hosts or alert types are most affected.
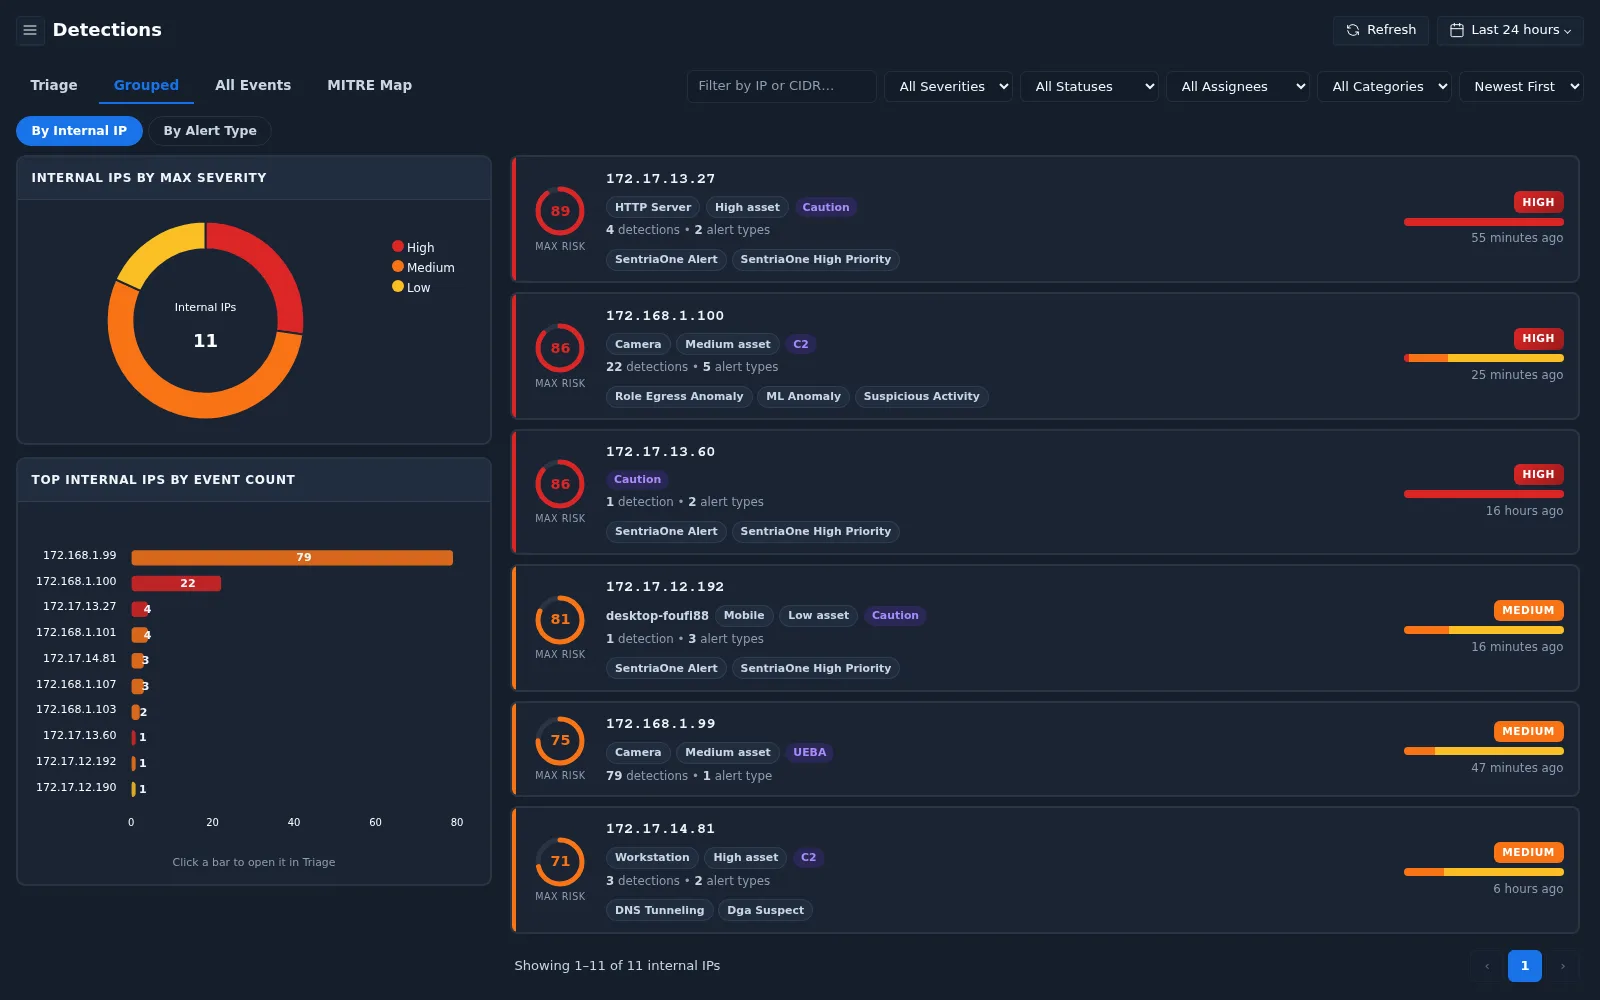
| Mode | Groups by | Each group shows |
|---|---|---|
| By Internal IP | Internal IP | Max risk, host role and criticality, category, number of detections and alert types, severity |
| By Alert Type | Alert type | Max risk, detection method (Signature or Behaviour), number of detections and internal IPs |
The bar chart at the top ranks groups by event count. Click a bar to open that group in Triage.
All Events
All Events lists every detection event individually, with an Events by Severity donut and an Event Timeline chart.
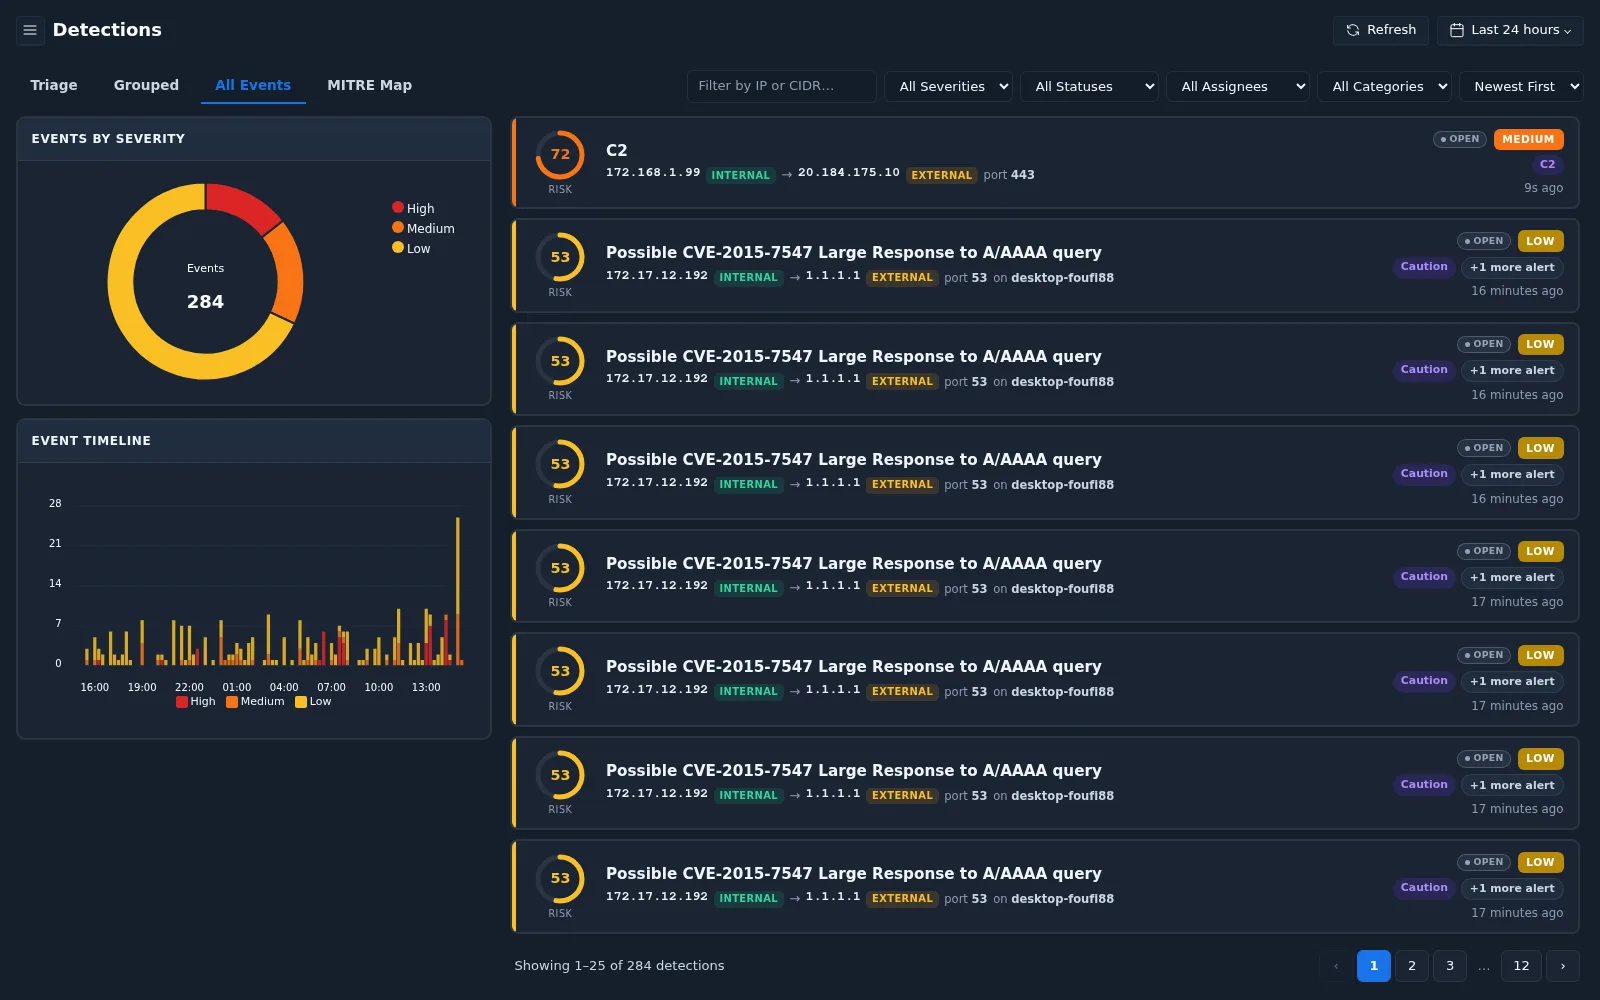
Each event shows risk, detection name, source and destination (marked
INTERNAL or EXTERNAL), port, hostname when known, status, severity,
category, and related alerts (for example +1 more alert or ×4 for repeated
occurrences). Select an event to open its
detail page.
MITRE Map
MITRE Map arranges detections on the MITRE ATT&CK matrix.
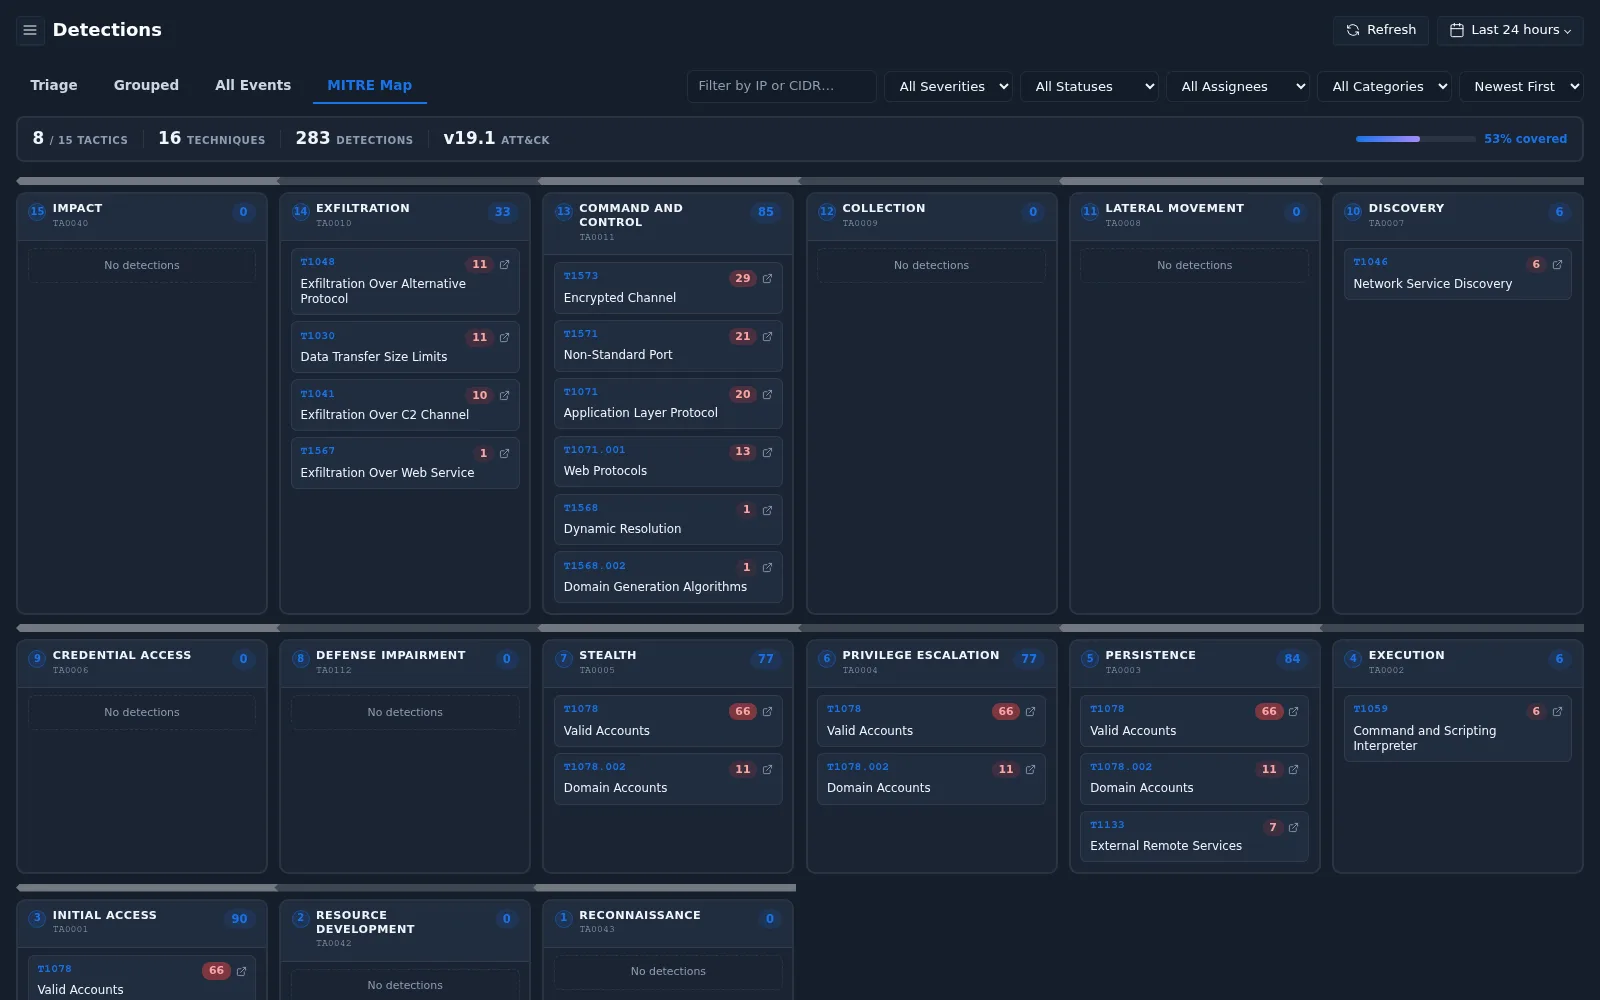
- The header shows tactics covered, techniques observed, total detections, ATT&CK version, and coverage percentage.
- Each column is a tactic (for example Exfiltration, Command and Control) with its detection count.
- Each card inside a column is a technique (for example T1573 Encrypted Channel) with its detection count. The link icon opens the technique on attack.mitre.org.
- Tactics without detections show No detections.
Use the MITRE Map to understand which stages of an attack are being observed in your environment. See Data Processing for background on MITRE ATT&CK.