Activity
The Activity page provides a detailed view for each observed protocol.
Menu: Applications › Activity
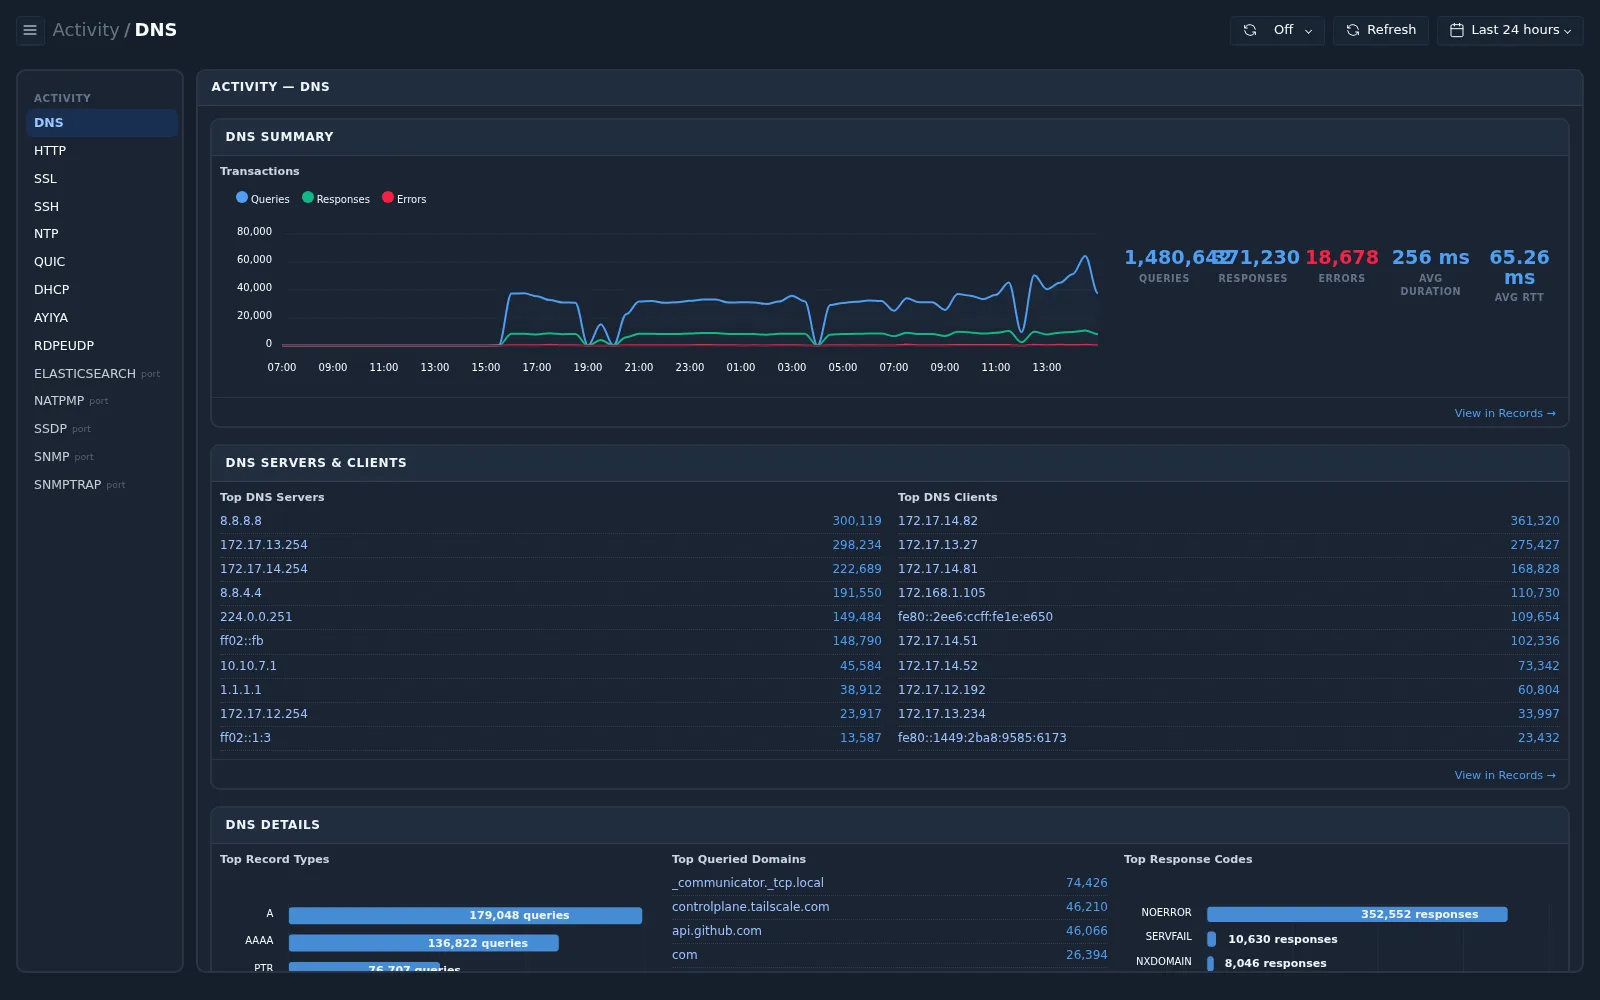
Selecting a protocol
The protocol list on the left shows the protocols seen in the selected time range, for example DNS, HTTP, SSL, SSH, NTP, QUIC, and DHCP.
A protocol marked port was inferred from the port number rather than identified from the protocol itself. Treat these views as indicative.
Each section on the page has a View in Records → link that opens the matching records.
Protocol views
DNS
| Section | Contents |
|---|---|
| DNS Summary | Transactions, queries, responses, and errors over time; average duration and round-trip time |
| DNS Servers & Clients | Top DNS servers and top DNS clients |
| DNS Details | Top record types, top queried domains, and top response codes |
HTTP
| Section | Contents |
|---|---|
| HTTP Summary | Requests over time, distinct URIs, average duration and round-trip time |
| Top Talkers | Top sources and top destinations |
| HTTP Details | Methods, top URIs, top hosts, and top user agents |
| Responses | Status codes, 4xx and 5xx errors, average response time and size |
SSL/TLS
| Section | Contents |
|---|---|
| TLS Summary | Sessions and established sessions over time, resumed sessions, average duration and round-trip time |
| Top Talkers | Top sources and top destinations |
| TLS Details | Top server names (SNI), TLS versions, and top ciphers |
Network
The network view is also available in each asset profile.
| Section | Contents |
|---|---|
| Throughput | Average and maximum bit rate in and out, and throughput by Layer 7 protocol |
| Network Latency | Average round-trip time, 95th percentile, and median |
| Packets & Retransmission | Packet rates, total packets, and TCP retransmission percentage |
| IP Protocols | Top IP protocols for inbound and outbound packets |
| Connection States | Distribution of connection states |
tip
If a panel shows Failed to load data, select Refresh. For large time ranges, try a shorter range.