Network Overview
The Network Overview page summarizes network traffic observed from packet mirroring. Data is aggregated in 5-minute intervals.
Menu: Network › Overview
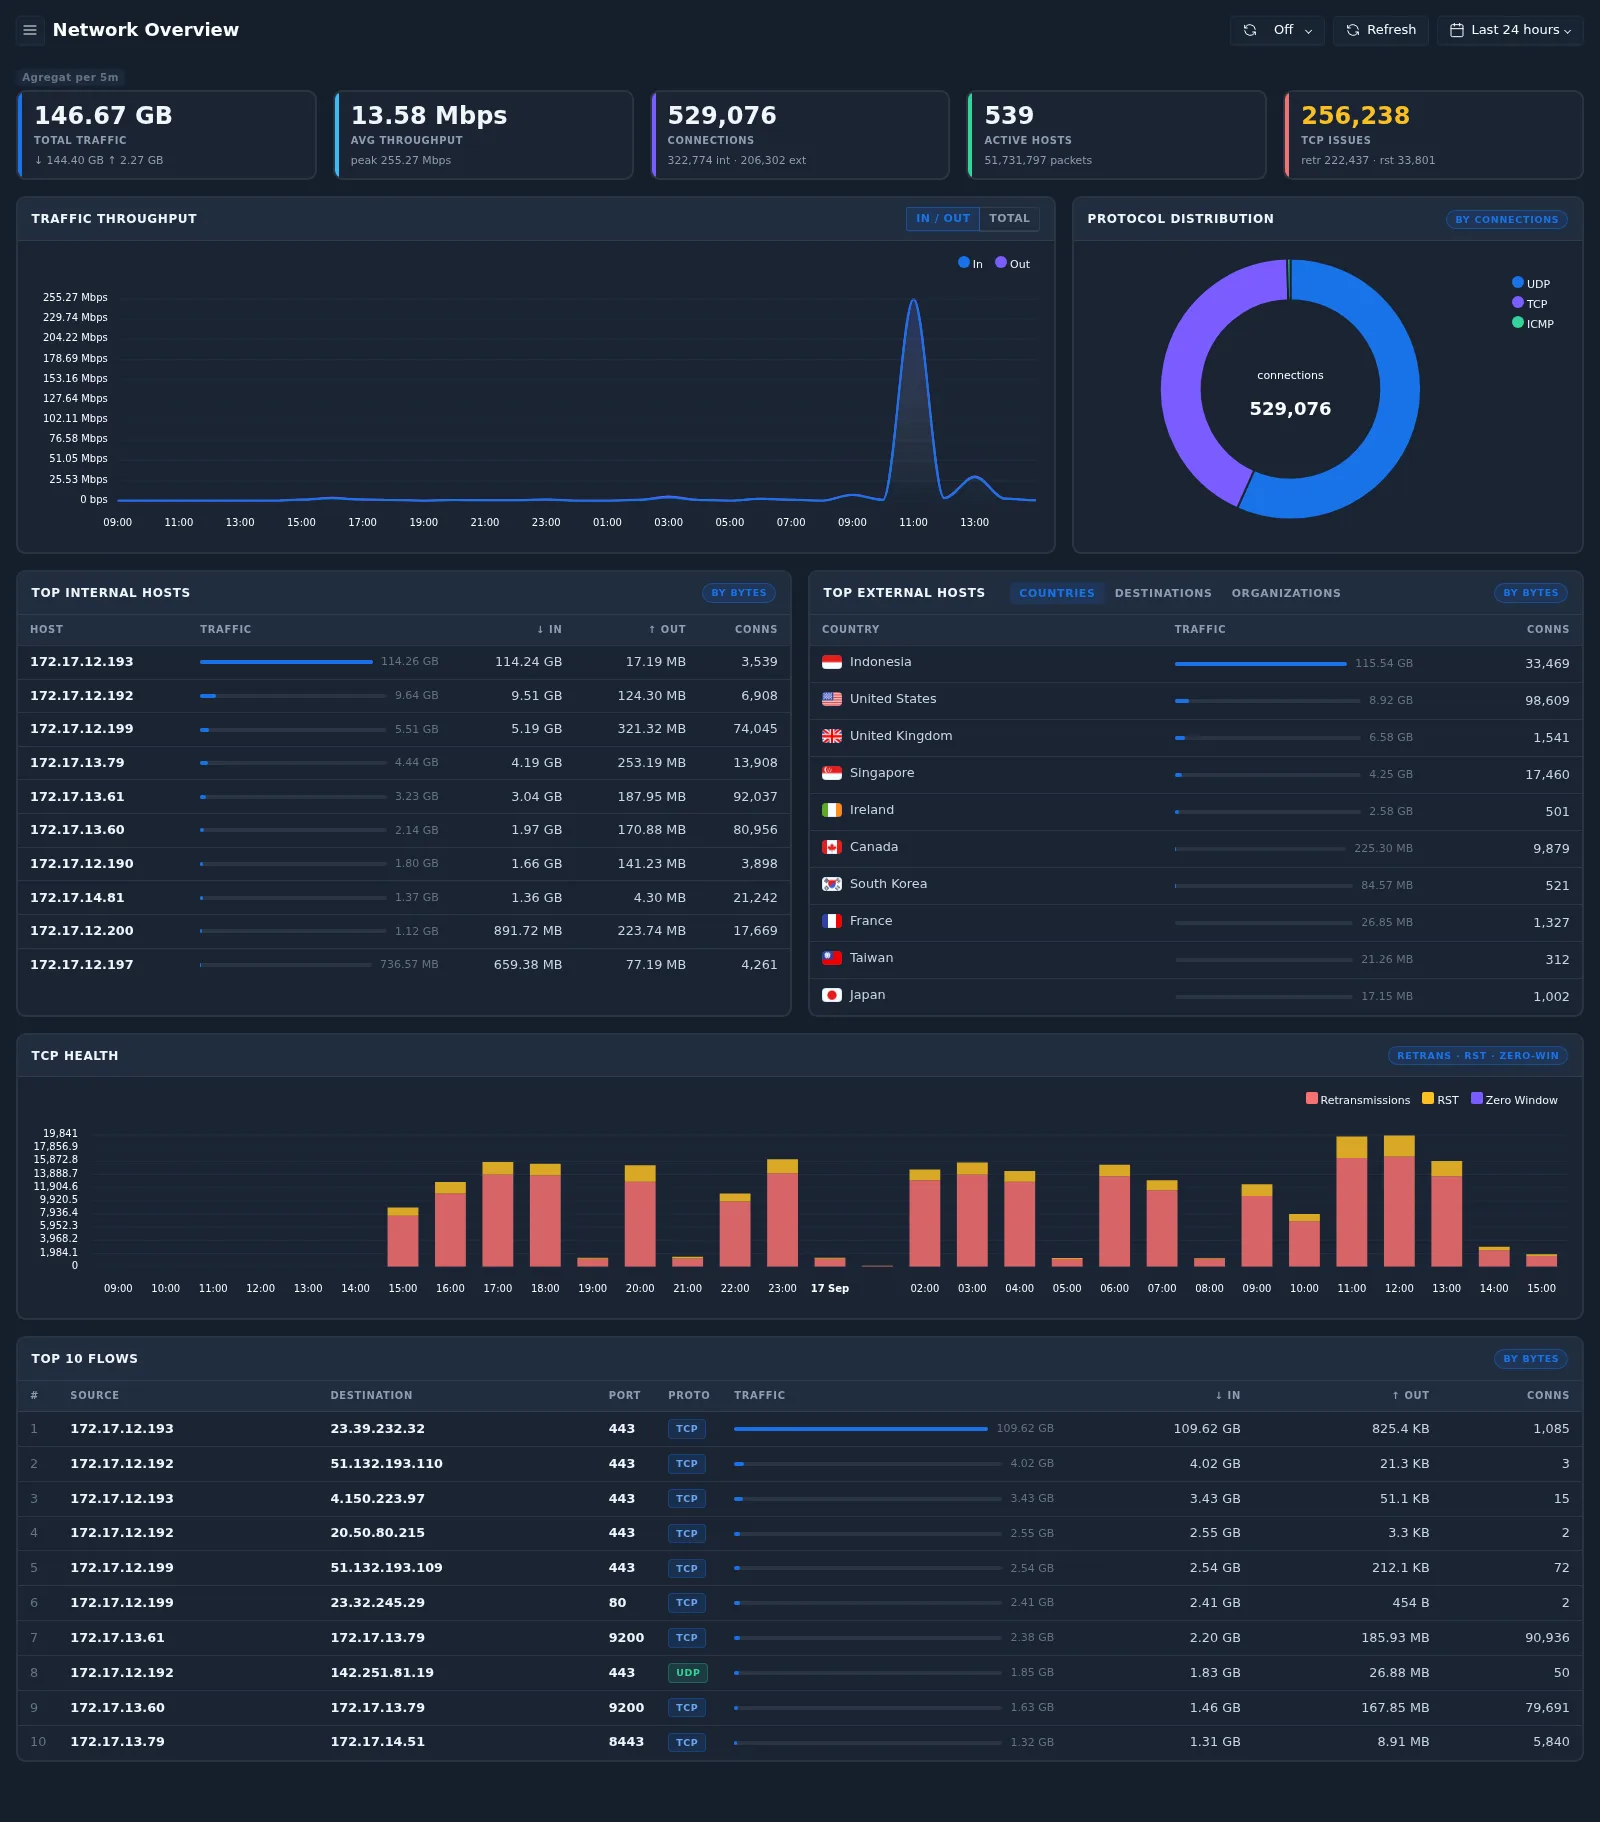
Summary cards
| Card | Shows | Drill-down |
|---|---|---|
| Total Traffic | Total bytes, split into download (↓) and upload (↑) | Total Traffic by host |
| Avg Throughput | Average bits per second and the peak value | — |
| Connections | Total connections, split into internal and external | Total Connections by host |
| Active Hosts | Number of active hosts and total packets | Active IPs by host |
| TCP Issues | TCP retransmissions (retr) and resets (rst) | TCP Retransmissions by host |
Panels
| Panel | How to read it |
|---|---|
| Traffic Throughput | Throughput over time. Switch between In / Out and Total |
| Protocol Distribution | Share of connections by transport protocol (TCP, UDP, ICMP) |
| Top Internal Hosts | Internal hosts ranked by bytes, with inbound, outbound, and connection counts |
| Top External Hosts | External traffic ranked by bytes. Switch between Countries, Destinations, and Organizations |
| TCP Health | Retransmissions, resets (RST), and zero-window events over time. High values can indicate congestion, packet loss, or failing connections |
| Top 10 Flows | Largest source–destination flows by bytes, with port, protocol, inbound, outbound, and connection counts |
Metric drill-down pages
Selecting a summary card opens a ranked table of hosts for that metric.
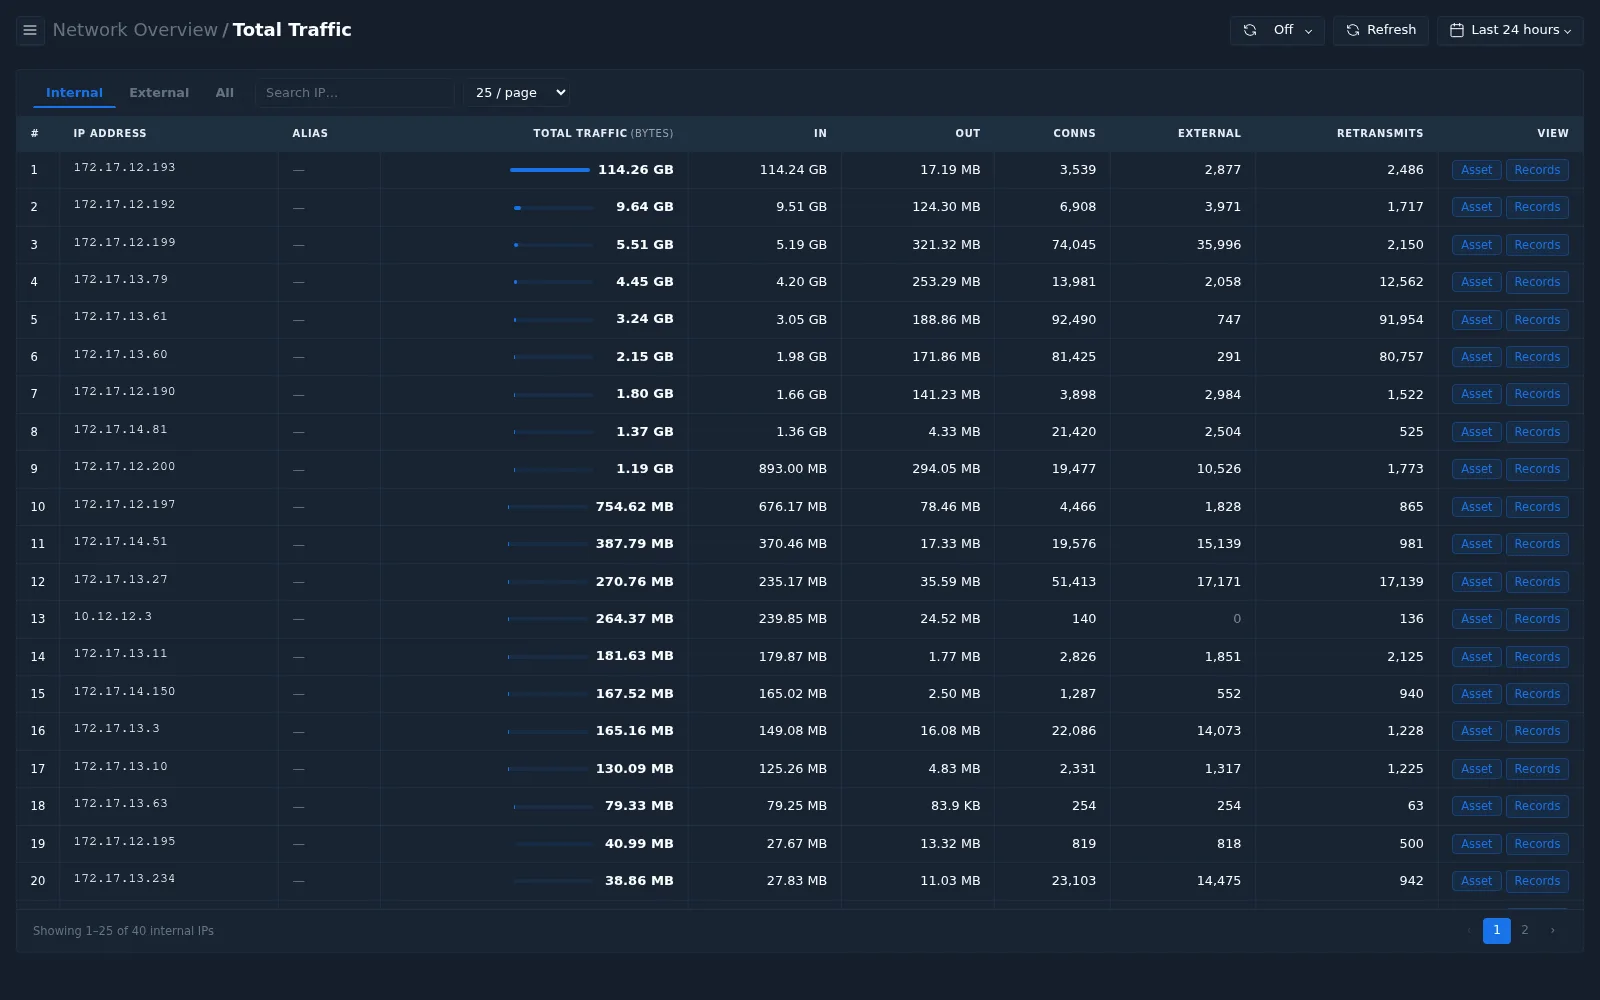
| Drill-down | Ranked by | Other columns |
|---|---|---|
| Total Traffic | Total bytes | In, out, connections, external, retransmits |
| Total Connections | Total connections | Internal, external, traffic, retransmits |
| Active IPs | Traffic bytes | Connections, external, in, out |
| TCP Retransmissions | TCP retransmissions | RST, zero window, connections, traffic |
On every drill-down page you can:
- Filter hosts by Internal, External, or All.
- Choose the number of rows per page (10, 25, 50, or 100).
- Open Asset or Records for any host.