Dashboard UI Overview
This section is the user guide for the SentriaOne xSIEM dashboard. It explains what each page shows, how to read its charts, and where each chart leads when you drill down.
Screenshots in this section were taken from a demonstration environment. Values, hosts, and detections in your environment will differ. Some identifying information has been masked.
Signing in
Open the dashboard URL provided by your administrator in a web browser and sign in with your username and password. After signing in, the Overview page is displayed.
To sign out, open the sidebar and select Sign out.
Navigation menu
Open the sidebar with the menu button (☰) in the top-left corner of any page.
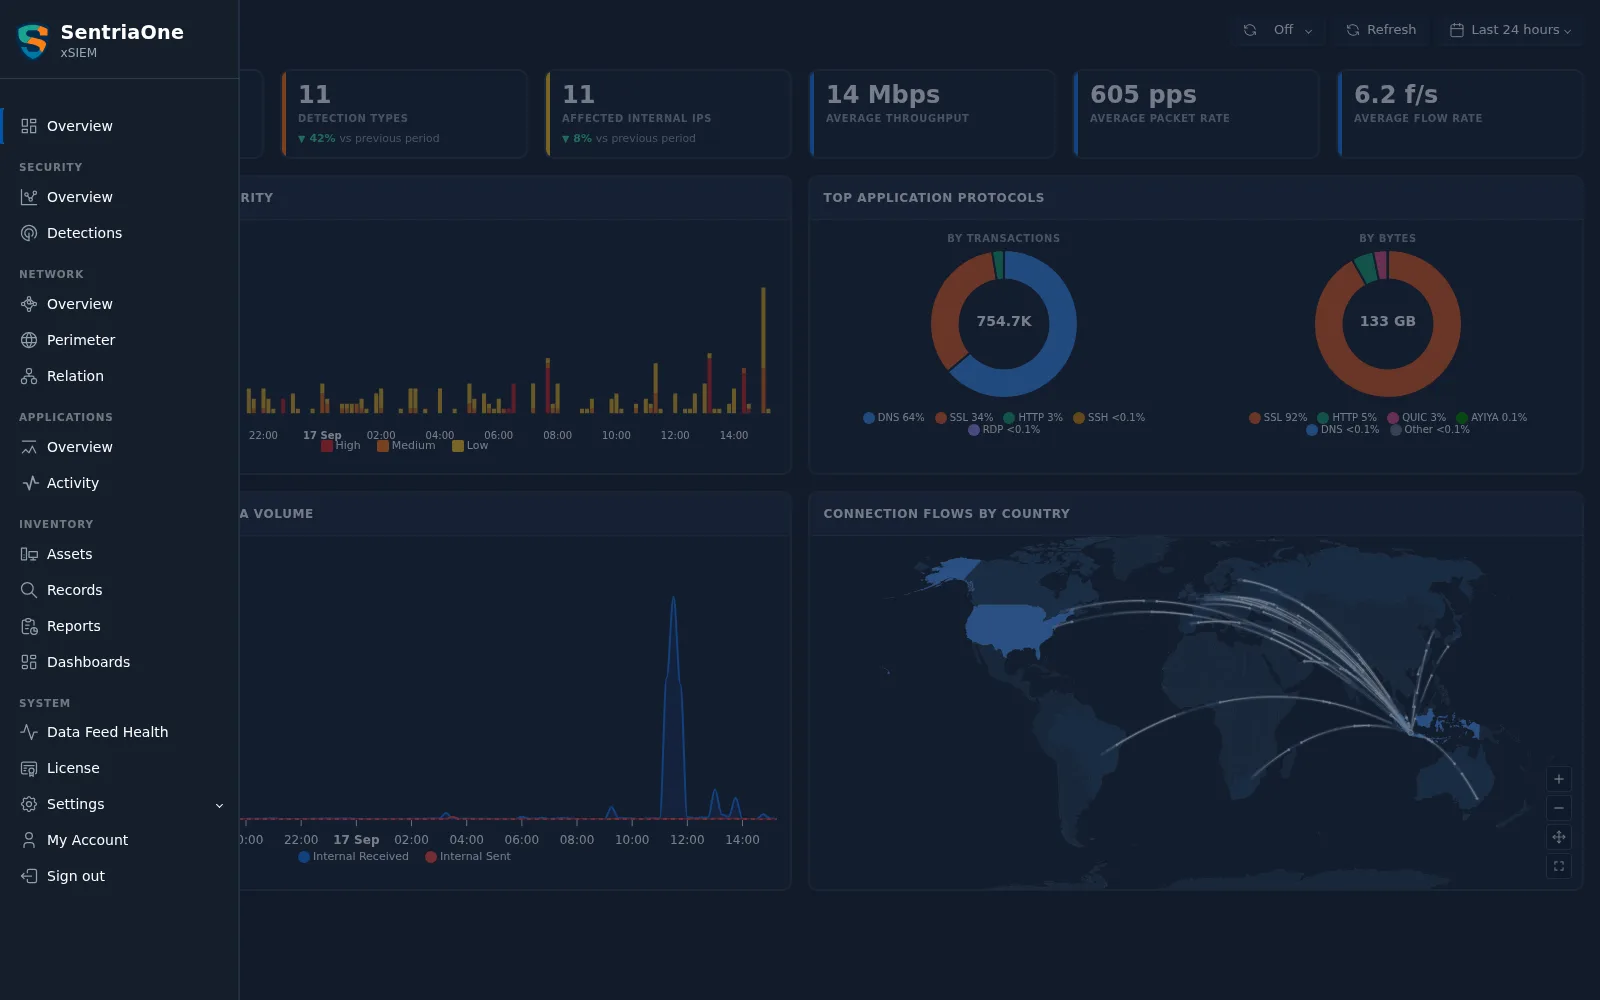
| Menu group | Page | Purpose |
|---|---|---|
| — | Overview | Combined summary of security, network, and application activity |
| Security | Overview | Detection posture, MITRE ATT&CK coverage, and tracking status |
| Security | Detections | Triage, grouping, event list, and MITRE map of detections |
| Network | Overview | Traffic volume, connections, hosts, and TCP health |
| Network | Perimeter | Traffic between internal hosts and external organizations/countries |
| Network | Relation | Interactive graph of communication between hosts |
| Applications | Overview | Application protocol activity, errors, and authentication |
| Applications | Activity | Per-protocol activity details (DNS, HTTP, SSL, and others) |
| Inventory | Assets | Discovered devices, device groups, and asset profiles |
| Inventory | Records | Search the underlying records |
| Inventory | Reports | Generate, schedule, and download reports |
| Inventory | Dashboards | Custom dashboards |
| System | Data Feed Health | Status of incoming traffic and log data |
| System | License | License validity and usage |
| System | Settings | Users, detection tuning, and network classification (Email is under Integration) |
| System | My Account | Profile and password |
Page controls
Most pages share the same controls in the top-right corner.
| Control | Description |
|---|---|
| Auto refresh | Reloads the page data automatically. Options: Off, 30 seconds, 1 minute, 5 minutes, 10 minutes |
| Refresh | Reloads the page data immediately |
| Time range | Selects the period shown. Options: Last 15 minutes, Last 1 hour, Last 6 hours, Last 12 hours, Last 24 hours, Last 7 days, Last 30 days, or a custom date/range |
The selected time range is kept when you move between pages. If a page shows No data for this time range, widen the time range.
Many summary cards also show a comparison with the previous period of the
same length — for example ▲ 400% vs previous period.
Drill-down navigation
The dashboard is designed to move from a summary to the evidence behind it. Most summary cards, chart bars, table rows, and IP addresses are clickable and open a more detailed page.
Two drill-down targets appear throughout the dashboard:
| Link | Opens |
|---|---|
| Asset | The asset profile of that IP address or device |
| Records | The Records page, pre-filtered for the selected item |
A breadcrumb at the top of each drill-down page (for example Network Overview / Total Traffic) shows where you came from and links back.
Suggested daily workflow
- Check Data Feed Health to confirm data is arriving.
- Review the Security Overview for new and high-risk detections.
- Work through open detections in Detections › Triage.
- Investigate each detection using its detail page and record the outcome in Detection Tracking.
- Use Network and Application views to look for unusual activity that has not raised a detection.
For complete step-by-step examples, see the Use Case section.