Overview Dashboard
The Overview page is the landing page after sign-in. It combines the most important security and network indicators on one screen.
Menu: Overview
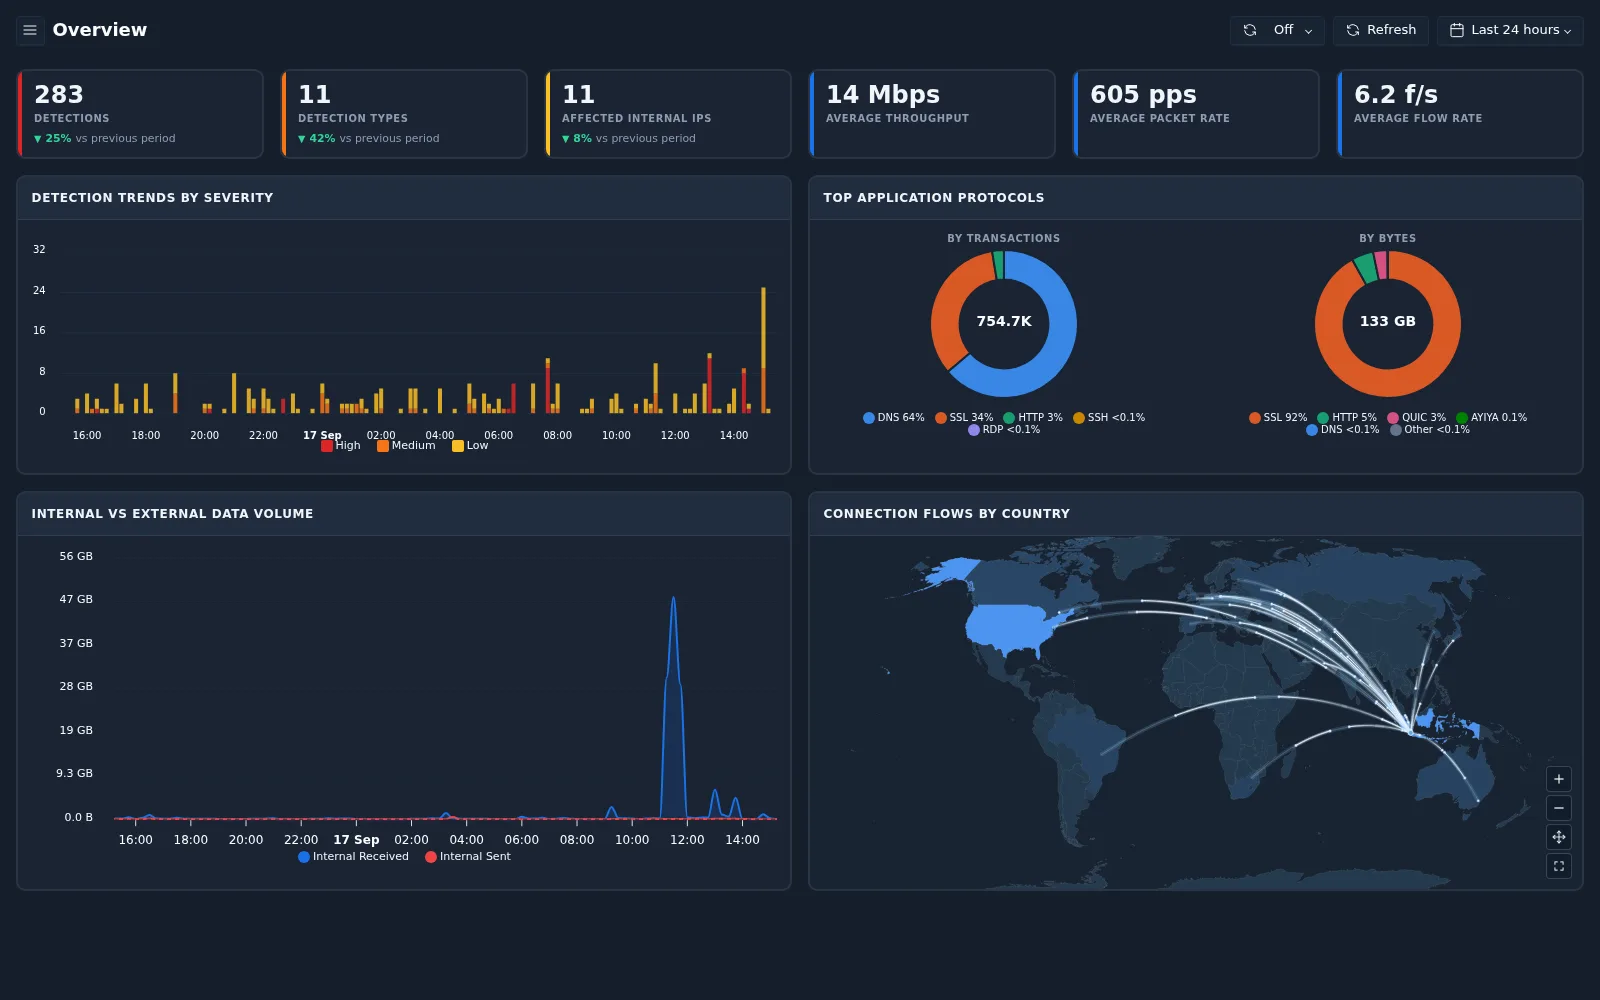
Summary cards
| Card | Shows | Drill-down |
|---|---|---|
| Detections | Number of detections in the time range | Detections |
| Detection Types | Number of distinct detection types | Detections |
| Affected Internal IPs | Number of internal IP addresses involved in detections | Detections › Grouped › By Internal IP |
| Average Throughput | Average traffic rate (bits per second) | Average Throughput Detail |
| Average Packet Rate | Average packets per second | Average Packet Rate Detail |
| Average Flow Rate | Average flows (connections) per second | Average Flow Rate Detail |
The first three cards also show the change compared with the previous period.
Charts
| Chart | How to read it |
|---|---|
| Detection Trends by Severity | Stacked bars of detections over time, split into High, Medium, and Low |
| Top Application Protocols | Two donut charts: share of application protocols by transactions and by bytes |
| Internal vs External Data Volume | Data received and sent by internal hosts over time. Sudden spikes may indicate large transfers |
| Connection Flows by Country | World map of connection flows between your network and other countries. Use the map controls to zoom and pan |
Rate detail pages
Selecting Average Throughput, Average Packet Rate, or Average Flow Rate opens a ranked table of the hosts that contribute most to that metric.
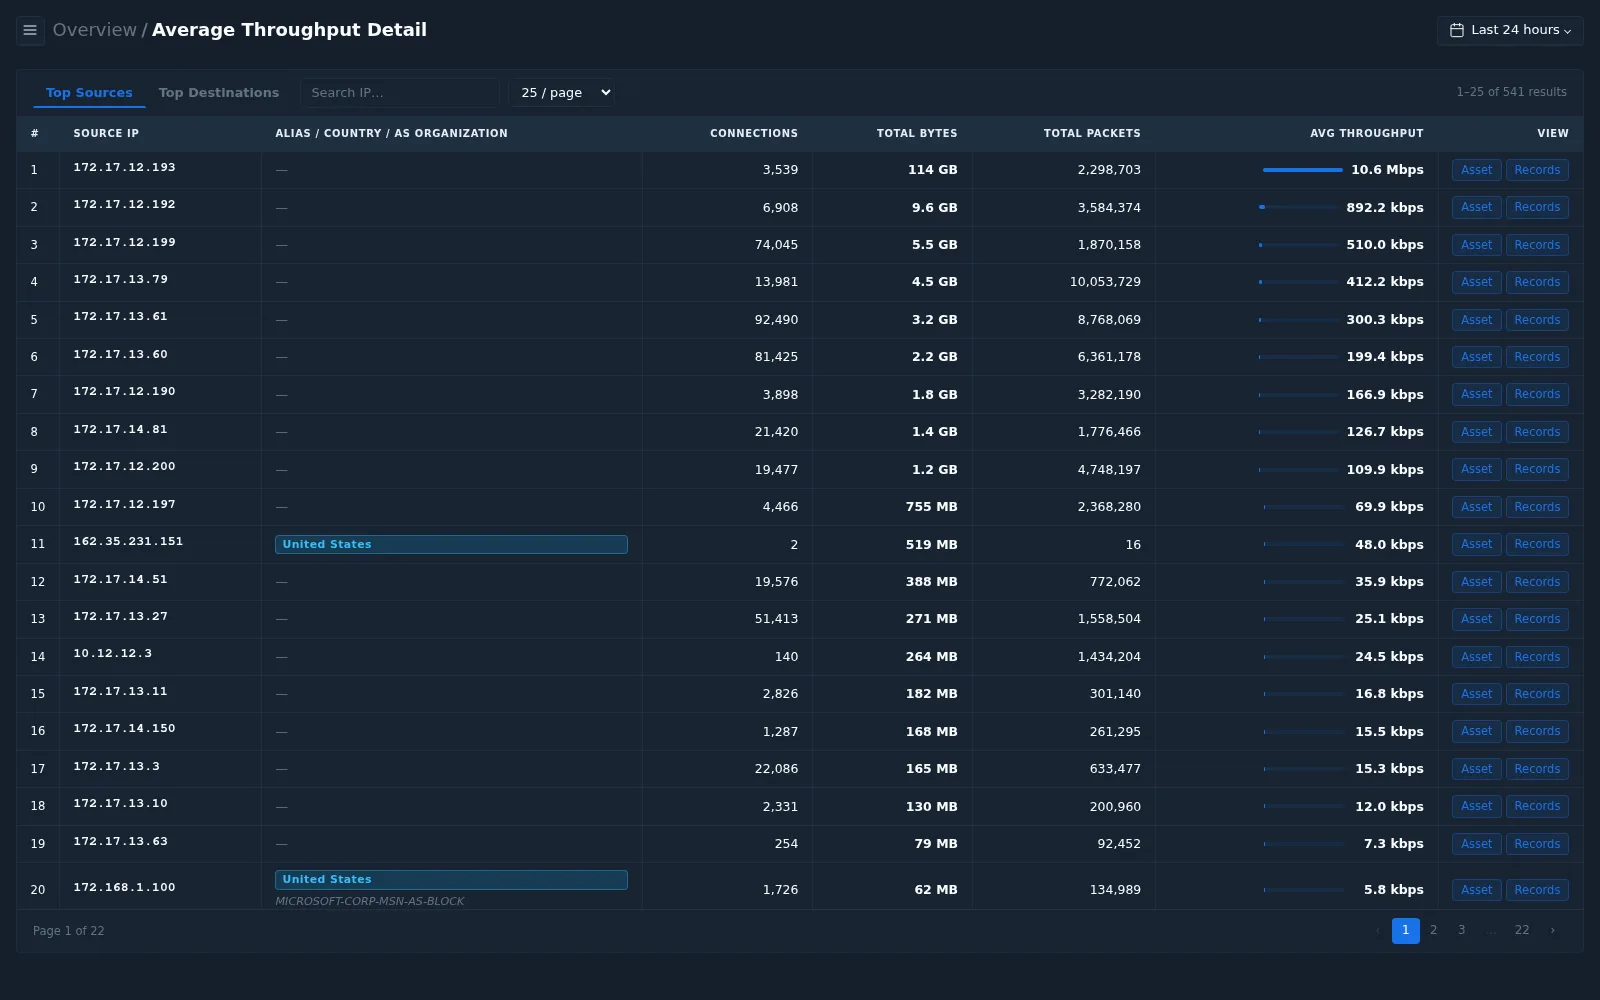
- Switch between Top Sources and Top Destinations.
- The Alias / Country / AS Organization column identifies external hosts.
- Use Asset or Records in the View column to continue the investigation.
| Detail page | Ranked by | Other columns |
|---|---|---|
| Average Throughput Detail | Average throughput | Connections, total bytes, total packets |
| Average Packet Rate Detail | Average packets/s | Connections, total packets, total bytes |
| Average Flow Rate Detail | Average flows/s | Flows, total bytes, total packets |