How to troubleshoot slow connections
Is it the network, the server, or something else?
"Searches in our application are slow. Is the network the problem?"
This is one of the most common questions an IT or security team receives. With Network Performance Monitoring (NPM), SentriaOne xSIEM answers it from the traffic itself — without installing anything on the servers and without waiting for the problem to happen again.
This walkthrough follows a real finding in a demonstration environment: a service conversation with one TCP retransmission for almost every connection.
Key metrics in one minute
| Metric | What it tells you | Healthy |
|---|---|---|
| Retransmissions | Packets that had to be sent again because they were lost or not acknowledged in time | A small fraction of packets |
| RST (reset) | Connections that were refused or aborted | Low |
| Zero window | The receiver asked the sender to pause — it could not keep up | Zero or close to zero |
| Round-trip time (RTT) | Time for a packet to reach the other side and be acknowledged | A few milliseconds inside a LAN |
| Connection state SF | The connection opened and closed normally | The large majority |
Step 1 — Spot the symptom on the Network Overview
Open Network › Overview. The TCP Issues card summarizes TCP problems in the time range — here 304,190 issues: 260,008 retransmissions and 44,182 resets.
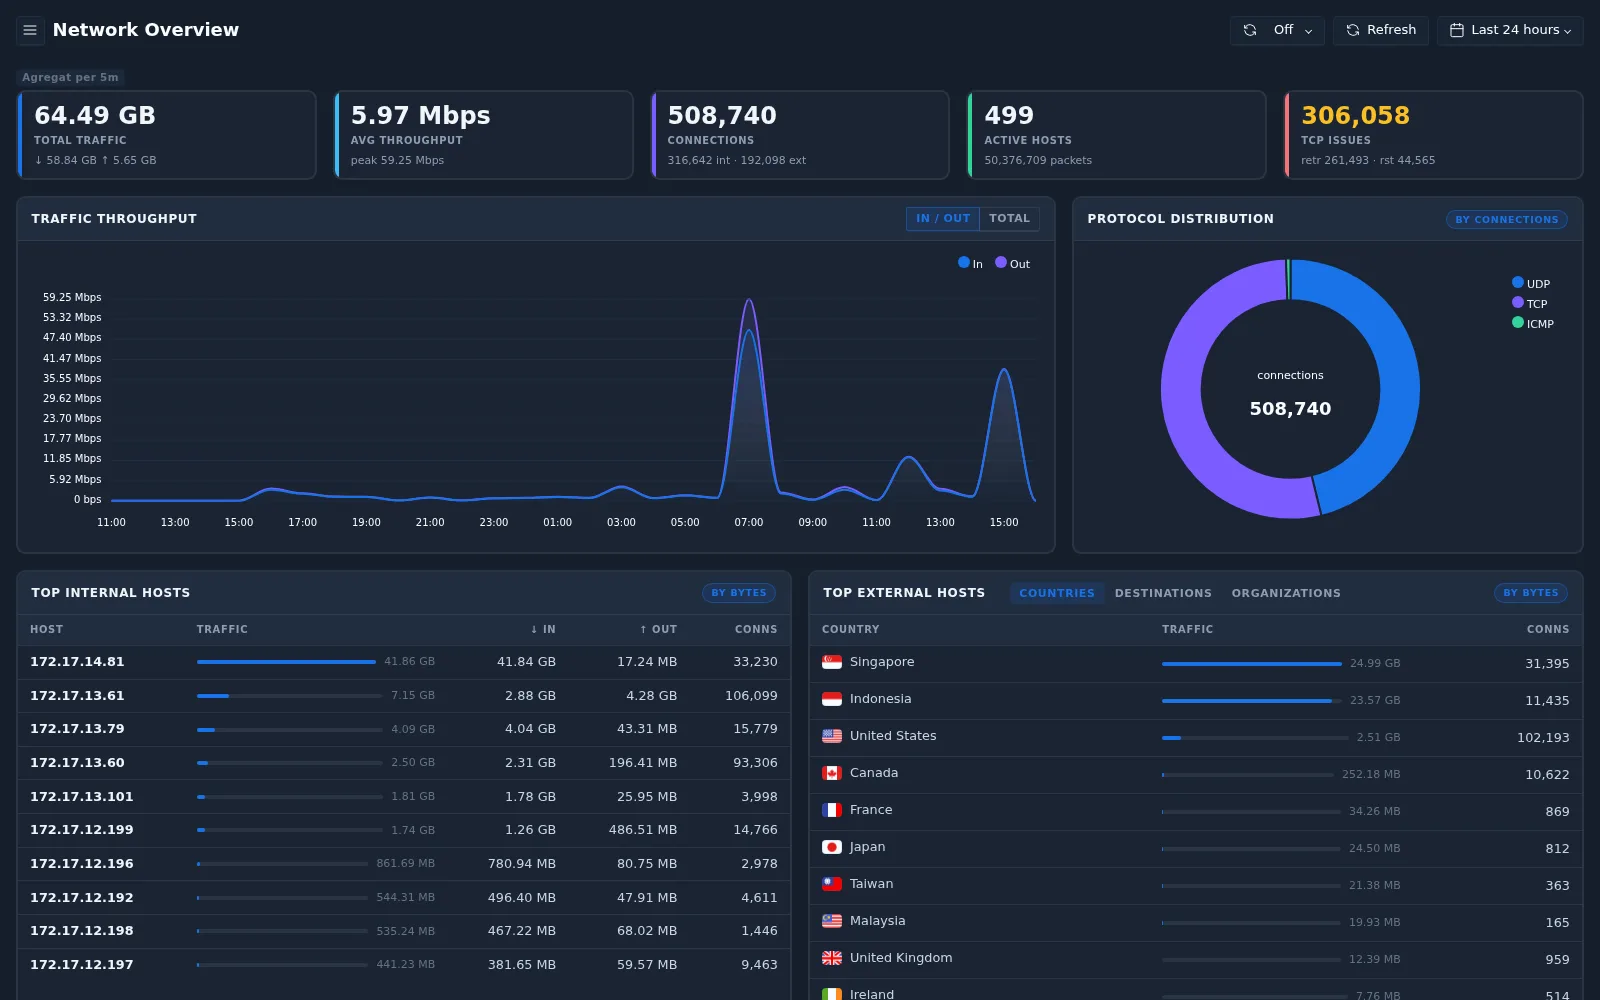
Scroll down to TCP Health and Top 10 Flows.
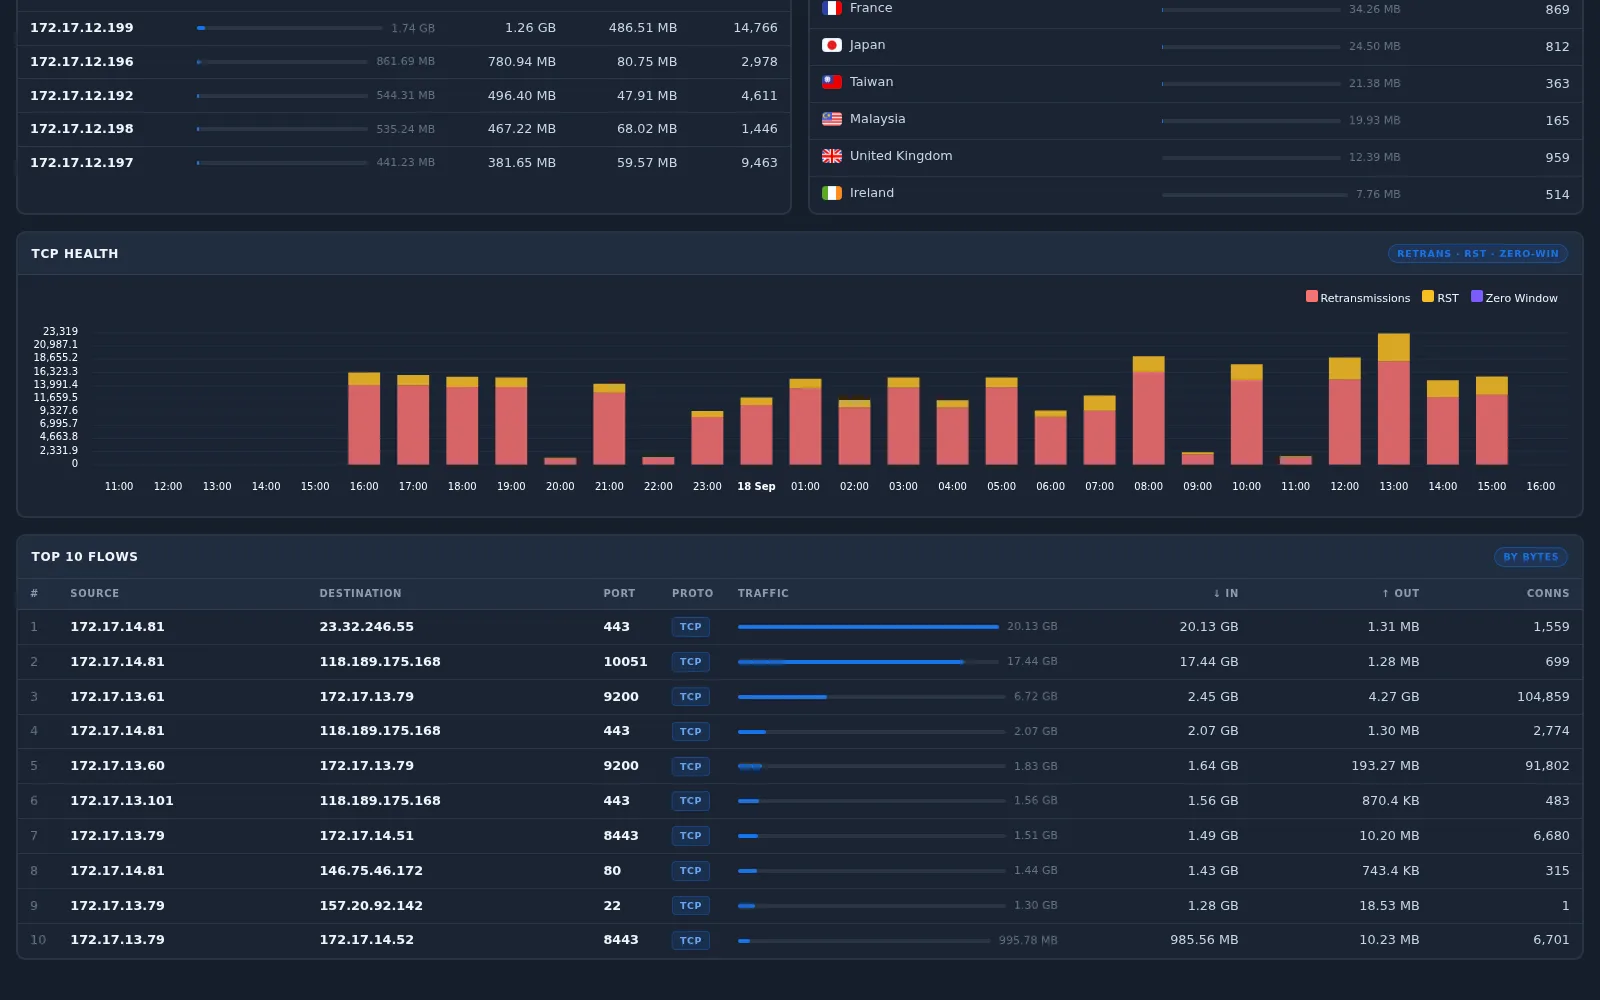
- TCP Health shows retransmissions (red) almost every hour of the day. A problem that is present all the time points to something systematic rather than a short outage.
- Top 10 Flows shows a busy internal conversation:
172.17.13.61→172.17.13.79on port 9200, with 104,859 connections. A second client,172.17.13.60, talks to the same server and port.
Step 2 — Rank the hosts by retransmissions
Select the TCP Issues card. The drill-down TCP Retransmissions ranks internal hosts.
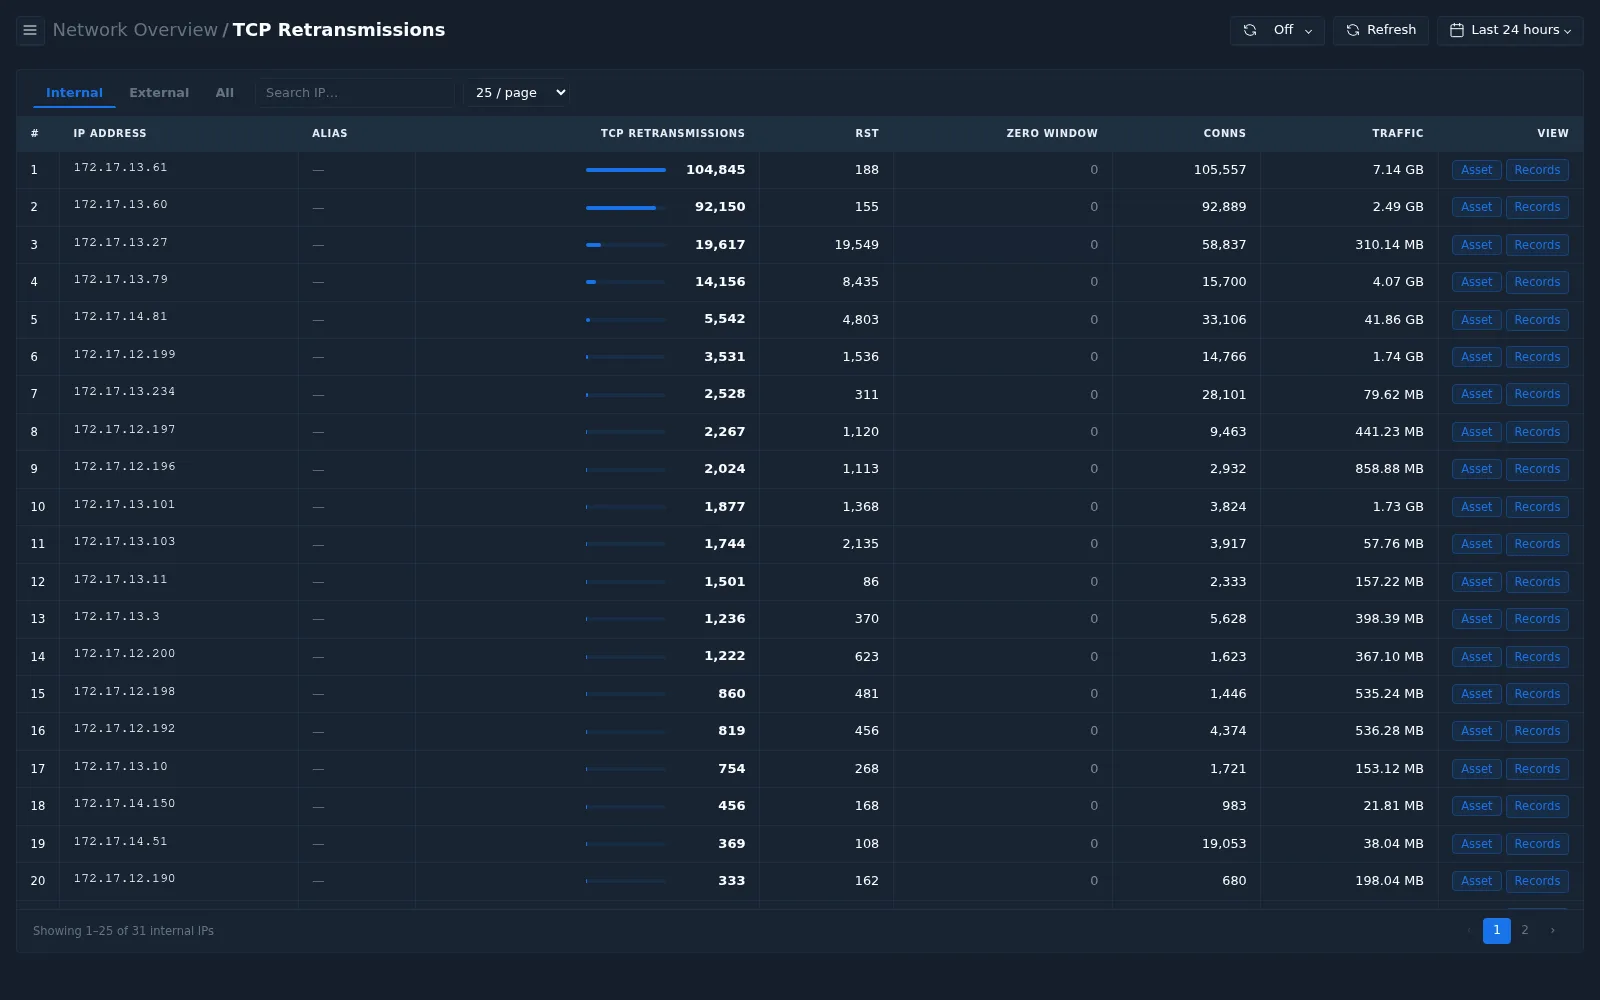
| Host | Retransmissions | RST | Zero window | Connections | Reading |
|---|---|---|---|---|---|
172.17.13.61 | 104,845 | 188 | 0 | 105,557 | About one retransmission per connection |
172.17.13.60 | 92,150 | 155 | 0 | 92,889 | The same pattern |
172.17.13.27 | 19,617 | 19,549 | 0 | 58,837 | Mostly resets — a different problem (see below) |
172.17.13.79 | 14,156 | 8,435 | 0 | 15,700 | The server both clients talk to |
Compare retransmissions with connections. When the two numbers are almost equal, the problem repeats on every connection in the same way.
172.17.13.27 has almost as many resets as retransmissions. Resets in large
numbers usually mean connections are being refused — for a public web server
this is typical of internet scanning. See
How to analyze top affected internal IPs for
that investigation.
Step 3 — Narrow down to the conversation
Select Records on the row of 172.17.13.61. The Records page opens with the
filters Entity IP: = 172.17.13.61 AND Retransmit Pct: > 0 — only the
connections of this host that had retransmissions.
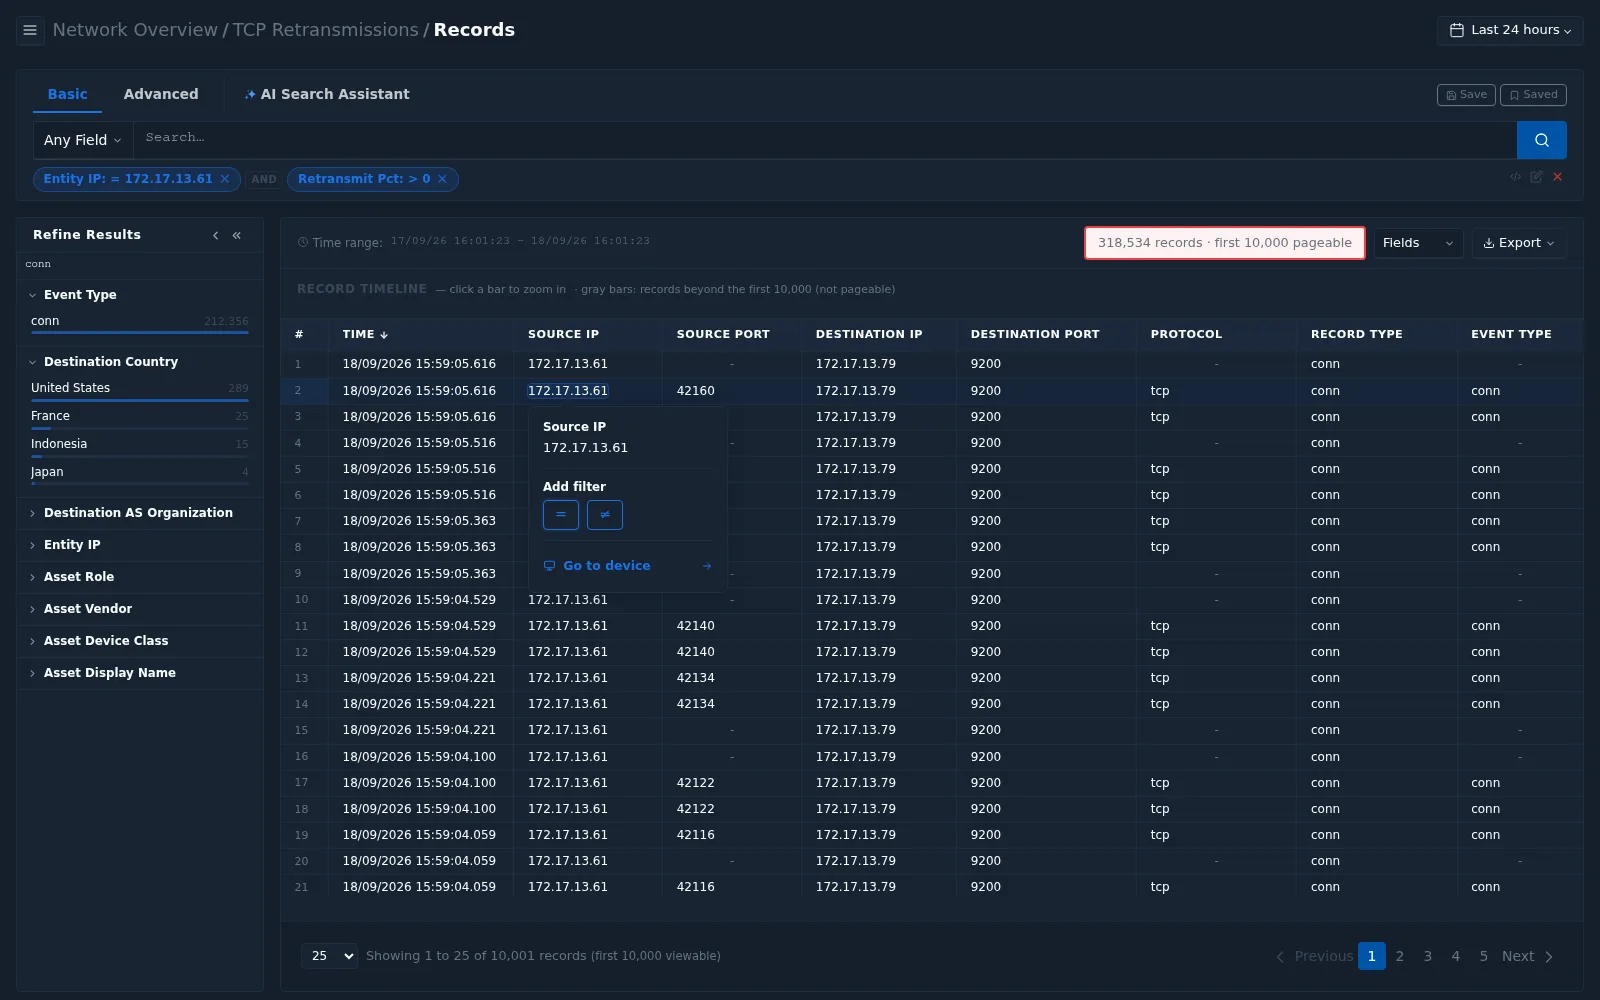
- Every record goes to the same destination:
172.17.13.79, port9200. The problem is not spread across the network — it is one conversation. - Select a value in a cell, such as the source IP, to Add filter (
=or≠) or Go to device. - Note that the same connection (same source port, for example
42160) appears in more than one record. Keep this in mind for Step 6.
Step 4 — Measure the client
Open the client's asset profile (Go to device, or the Asset link in the drill-down) and select Network.
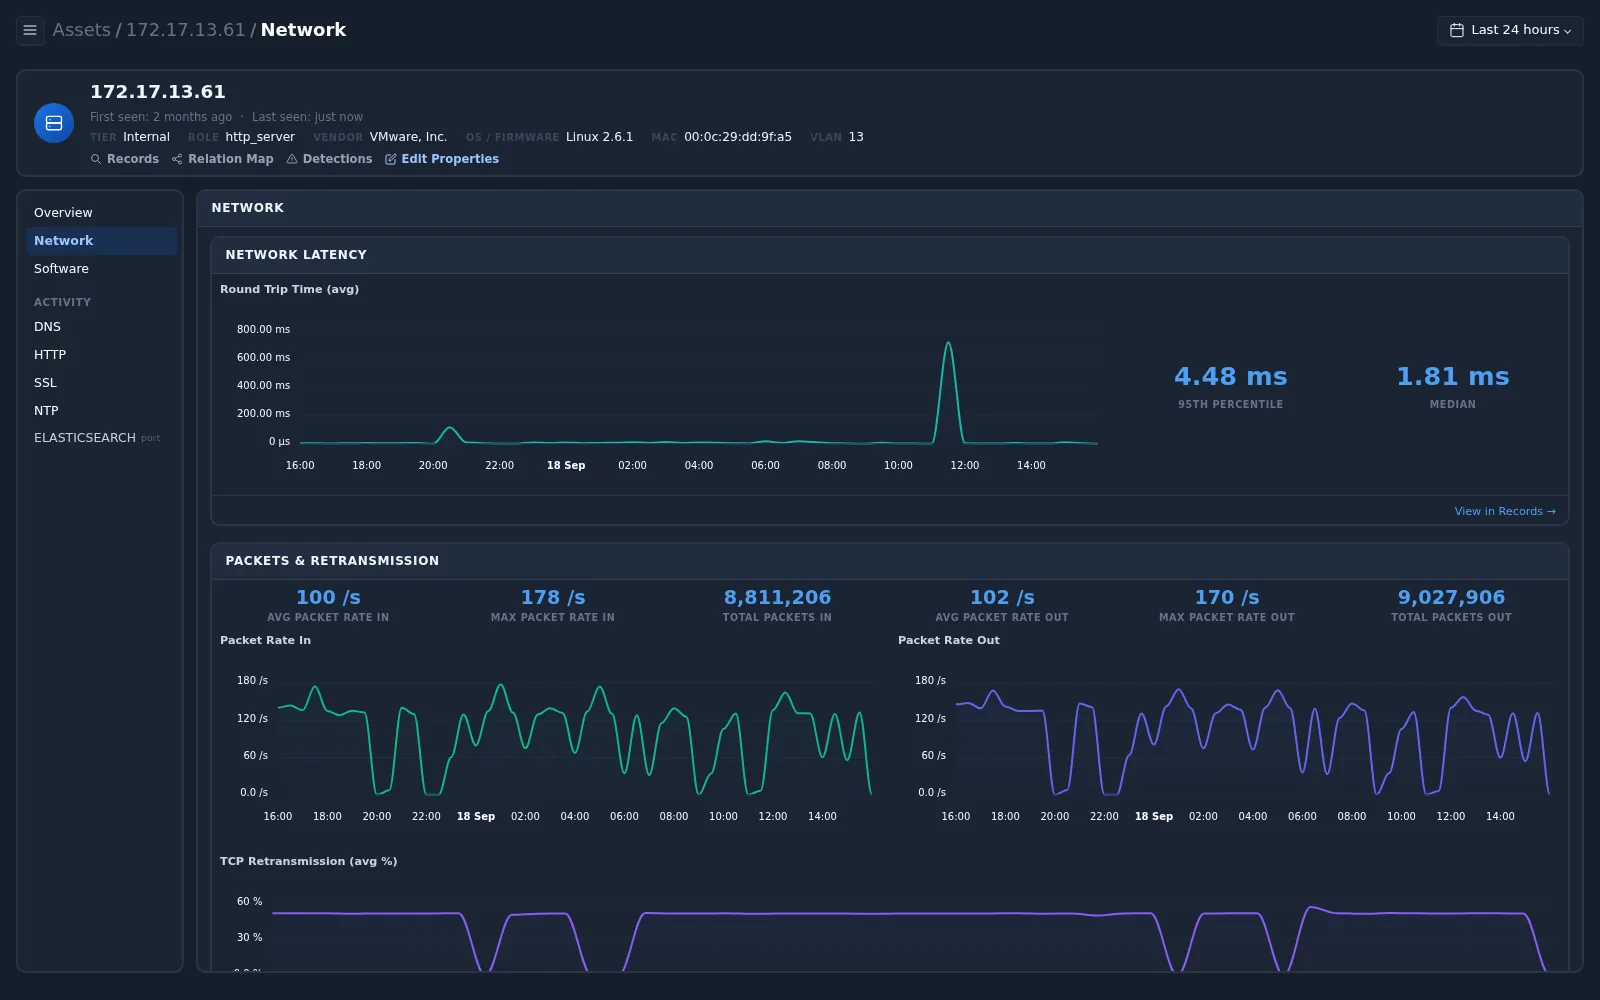
| Measurement | Value for 172.17.13.61 | Meaning |
|---|---|---|
| Round-trip time — median | 1.81 ms | Packets reach the server and are acknowledged quickly |
| Round-trip time — 95th percentile | 4.48 ms | Even slow cases are fast — no sign of a congested path |
| TCP Retransmission (avg %) | Elevated throughout the day | Retransmissions are constant, not tied to busy hours |
Scroll to Connection States.
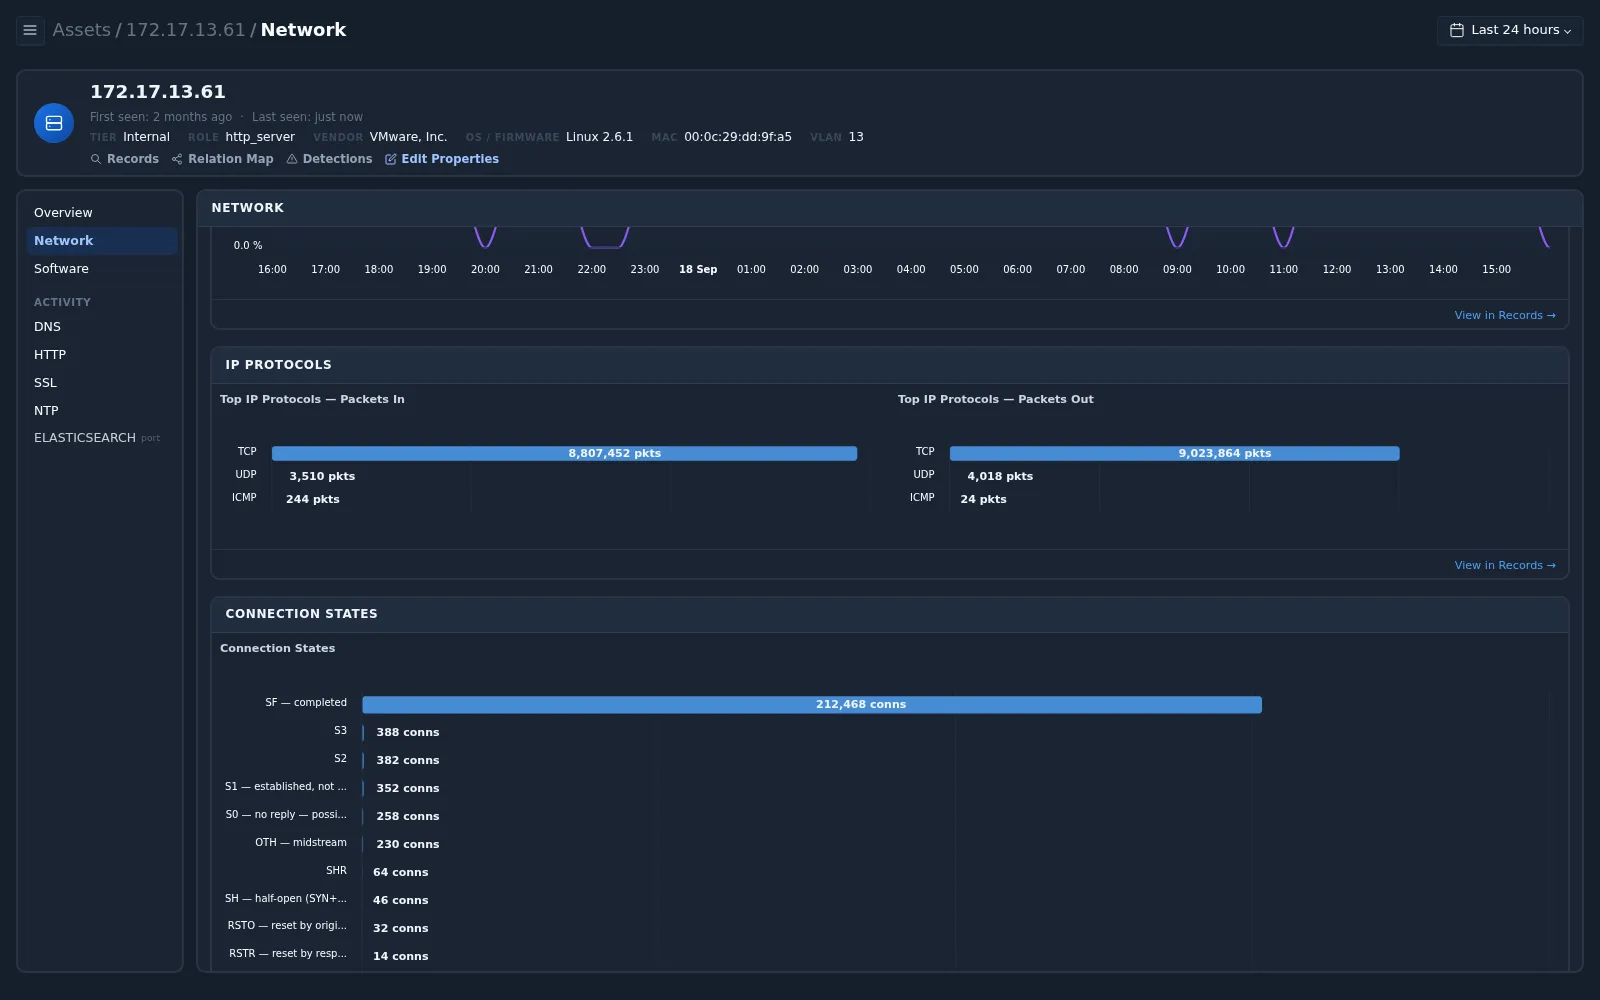
212,468 connections ended in state SF — completed. Only a few hundred ended as S0 (no reply), RSTO or RSTR (reset). The connections succeed.
Step 5 — Check the server
Open the asset profile of the destination, 172.17.13.79.
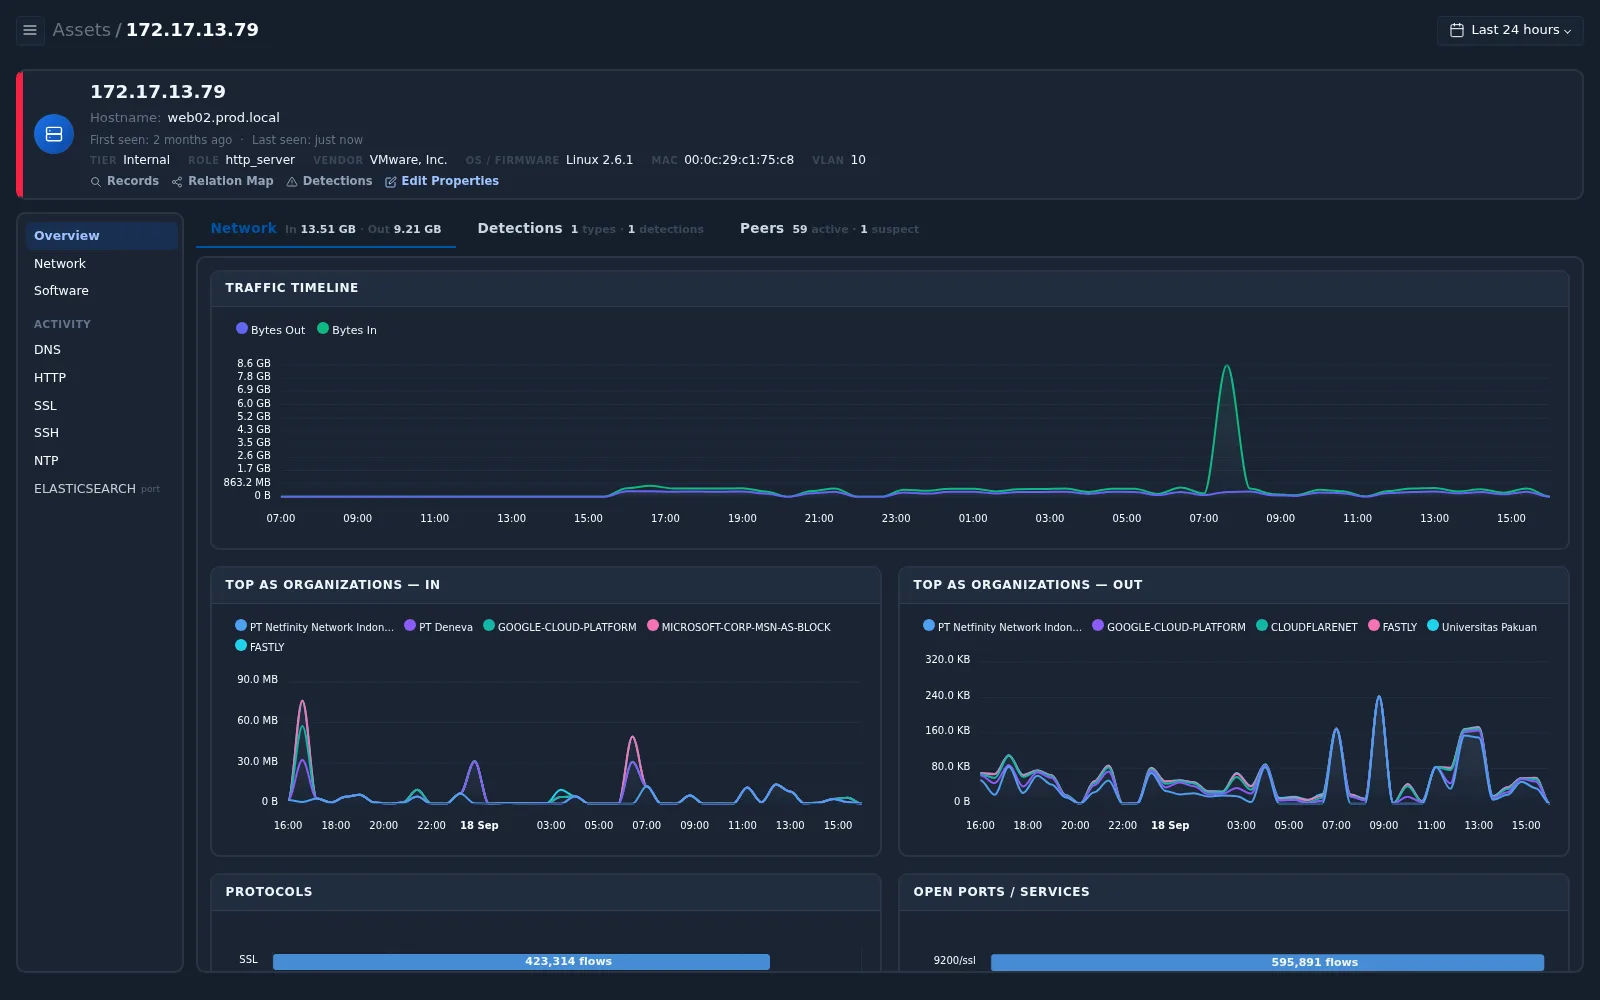
| Attribute | Value | Meaning |
|---|---|---|
| Hostname | web02.prod.local | The server behind the slow searches |
| Open ports / services | 9200/ssl (the busiest service) | Port 9200 is commonly used by search engines such as Elasticsearch; here it is served over TLS |
| VLAN | 10 (the client is in VLAN 13) | Traffic between client and server is routed between VLANs |
Step 6 — Diagnose: network, server, or capture?
Put the evidence together:
| Evidence | Points to |
|---|---|
| RTT median 1.81 ms, 95th percentile 4.48 ms | Not a slow or congested network path |
| Zero window = 0 | Not a receiver that cannot keep up |
| Almost all connections end in SF (completed) | Connections succeed; this is not an outage |
| About one retransmission per connection, all day | A systematic effect that repeats on every connection |
| ~105,000 connections per day to port 9200 (over one per second) | The client opens a new connection for each request |
| The same connection appears in more than one record; client and server are in different VLANs | Packets may be captured twice |
Use this matrix for any similar investigation:
| Pattern | Most likely area | What to check next |
|---|---|---|
| High RTT + retransmissions + many S0 or resets | Network path | Link utilization, errors on switch ports, Wi-Fi, WAN links |
| High zero window | Receiver / server | Server CPU, memory, disk, and application load |
| Many RST | Refused connections | Closed ports, firewalls, or scanning (see Security pages) |
| Low RTT, completed connections, ~1 retransmission per connection | Systematic / capture | Duplicate mirroring, connection handling in the application |
For this example, the recommended checks are:
- Rule out duplicate capture. Traffic routed between VLAN 10 and VLAN 13 can be mirrored twice if both VLANs (or both the access and uplink ports) are SPAN sources. A packet seen twice looks like a retransmission. Review the mirror configuration — see Packet Mirroring Configuration and Planning considerations.
- Review the connection pattern with the application team. Opening a new TLS connection for every request adds a handshake to each search. Reusing connections (keep-alive or a connection pool) usually makes such applications noticeably faster.
- Check the server
web02.prod.localfor load at the times users report slowness, and compare with the Throughput and Packet Rate charts on its Network tab.
Conclusion for the ticket: The network path between the application and the search server is fast (RTT under 5 ms) and connections complete normally. The constant retransmission count is systematic — first verify it is not caused by duplicate mirroring; then review connection reuse in the application and the load on the search server.
Step 7 — Share the result
- Send the Network Report from Reports to the network or application team, or schedule it to track improvement over time.
- After a change (for example connection reuse or a mirroring fix), repeat Steps 2–4 and compare the retransmission ratio and connection count.
Checklist
| Step | Question to answer | Where |
|---|---|---|
| 1 | Are there TCP problems? All day or at specific times? | Network Overview › TCP Issues, TCP Health |
| 2 | Which hosts are affected? Retransmissions or resets? | TCP Issues › TCP Retransmissions |
| 3 | Which conversation causes it? | Records (Retransmit Pct > 0) |
| 4 | Is the path slow? Do connections complete? | Asset › Network: latency, retransmission, connection states |
| 5 | What is the server and service? | Server asset profile |
| 6 | Network, server, application, or capture? | Diagnosis matrix |
| 7 | Who needs the result? | Reports › Network Report |