How to analyze top affected internal IPs
This walkthrough shows how an analyst investigates an internal host that appears in the Affected Internal IPs card — from the first click on the Overview to a documented decision in Detection Tracking.
The example uses real detections from a demonstration environment. The same steps apply to any internal IP.
Step 1 — Start from Affected Internal IPs
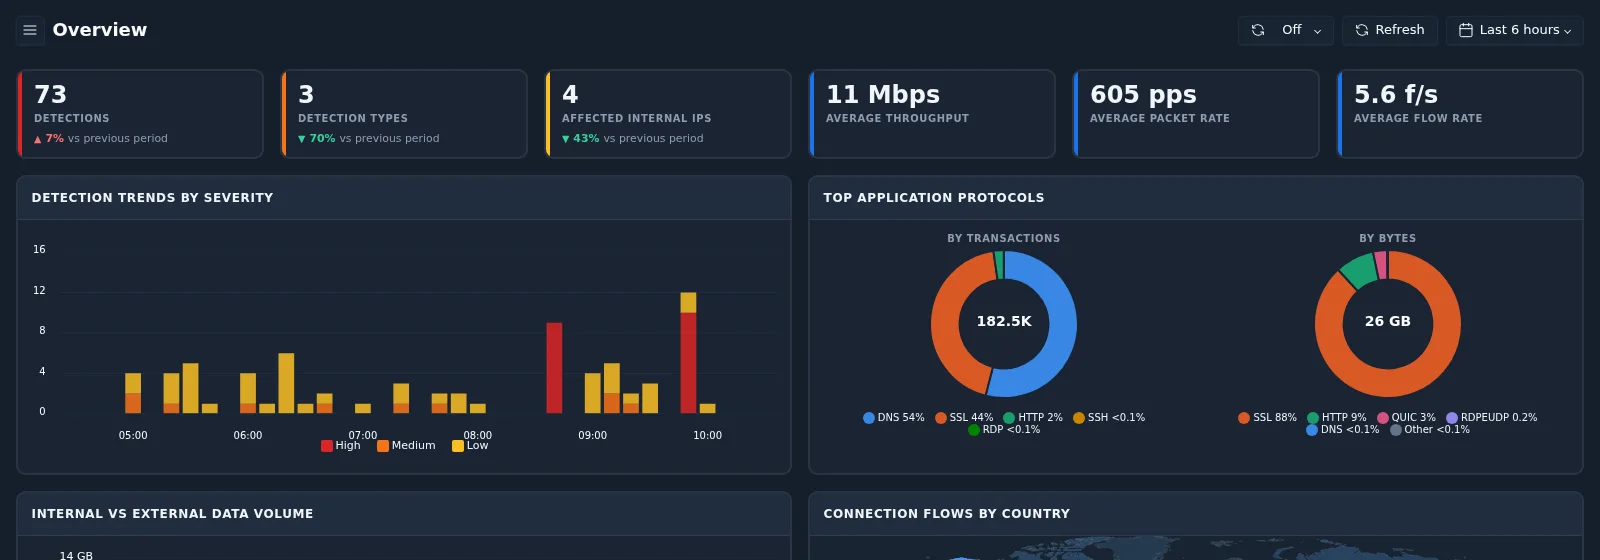
On the Overview page, set the time range (this example uses Last 6 hours) and select the Affected Internal IPs card. The card shows how many internal hosts are involved in detections.
Step 2 — Pick the highest-risk internal IP
The card opens Detections › Grouped › By Internal IP. Each internal IP is listed with its maximum risk, role, asset criticality, category, and number of detections. The colour bar shows the highest severity: red is High.
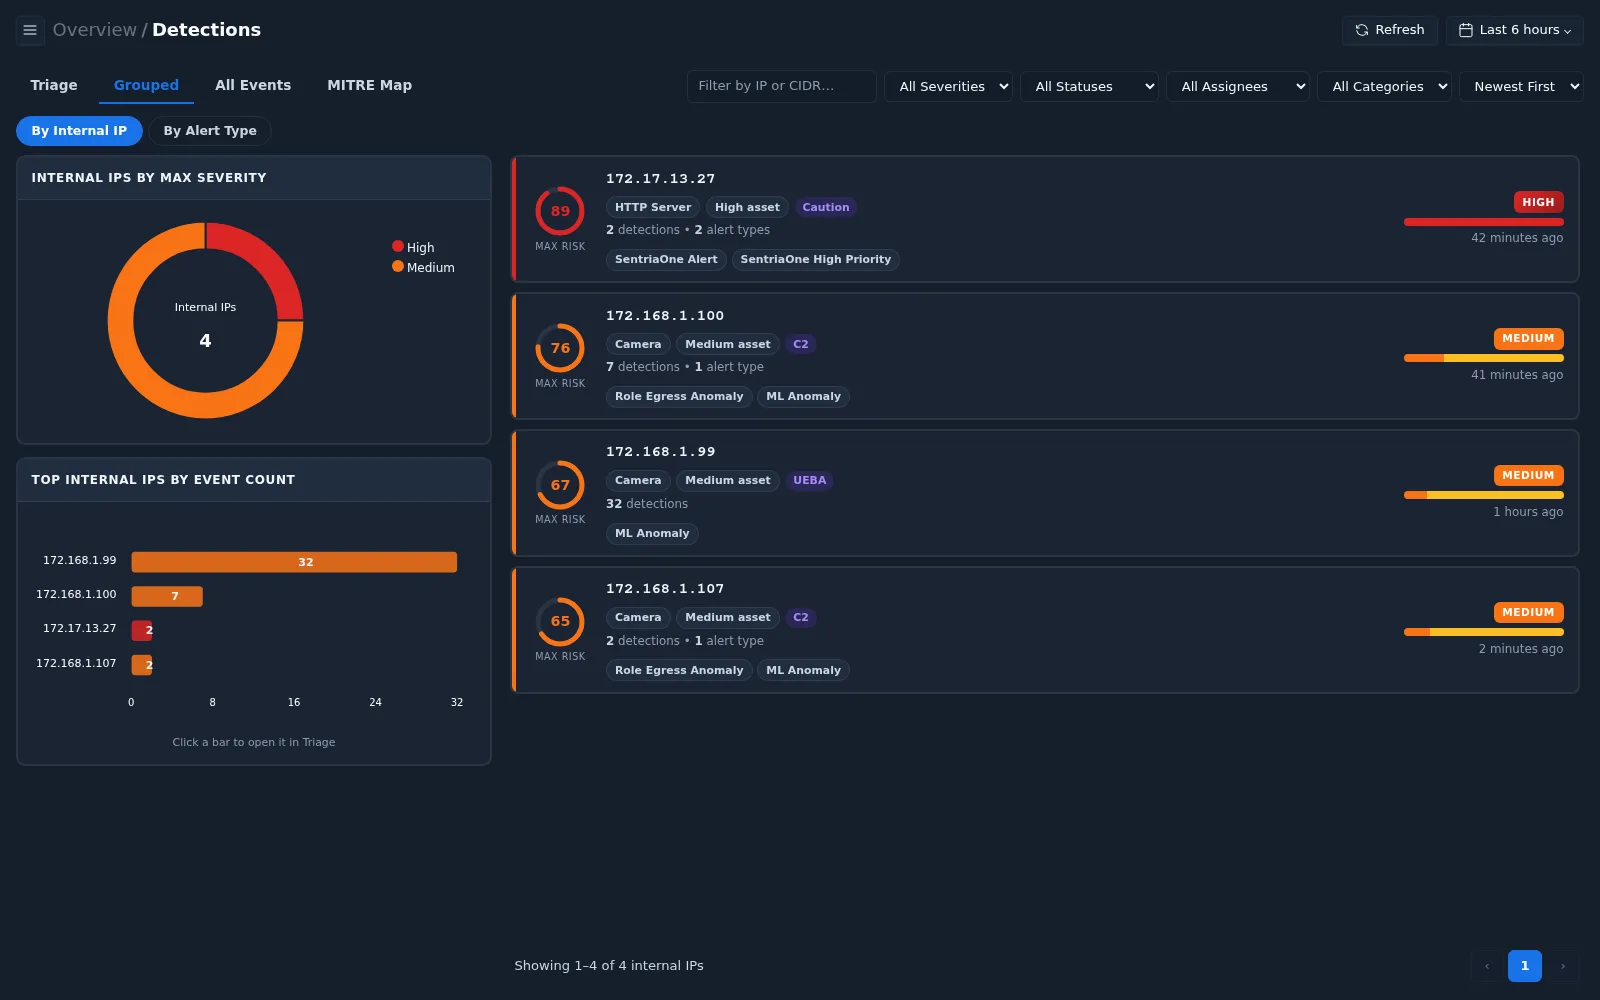
In this example the top entry is:
| Field | Value | Why it matters |
|---|---|---|
| Internal IP | 172.17.13.27 | The host to investigate |
| Max risk | 89 (High) | Highest risk in the list |
| Role / asset | HTTP Server, High asset | A critical server — impact would be significant |
| Category | Caution | Signature-based detection of attack traffic |
| Detections | 2 detections, 2 alert types | Two different activities to review |
Select the entry to open it in Triage.
Step 3 — Triage the detections of the host
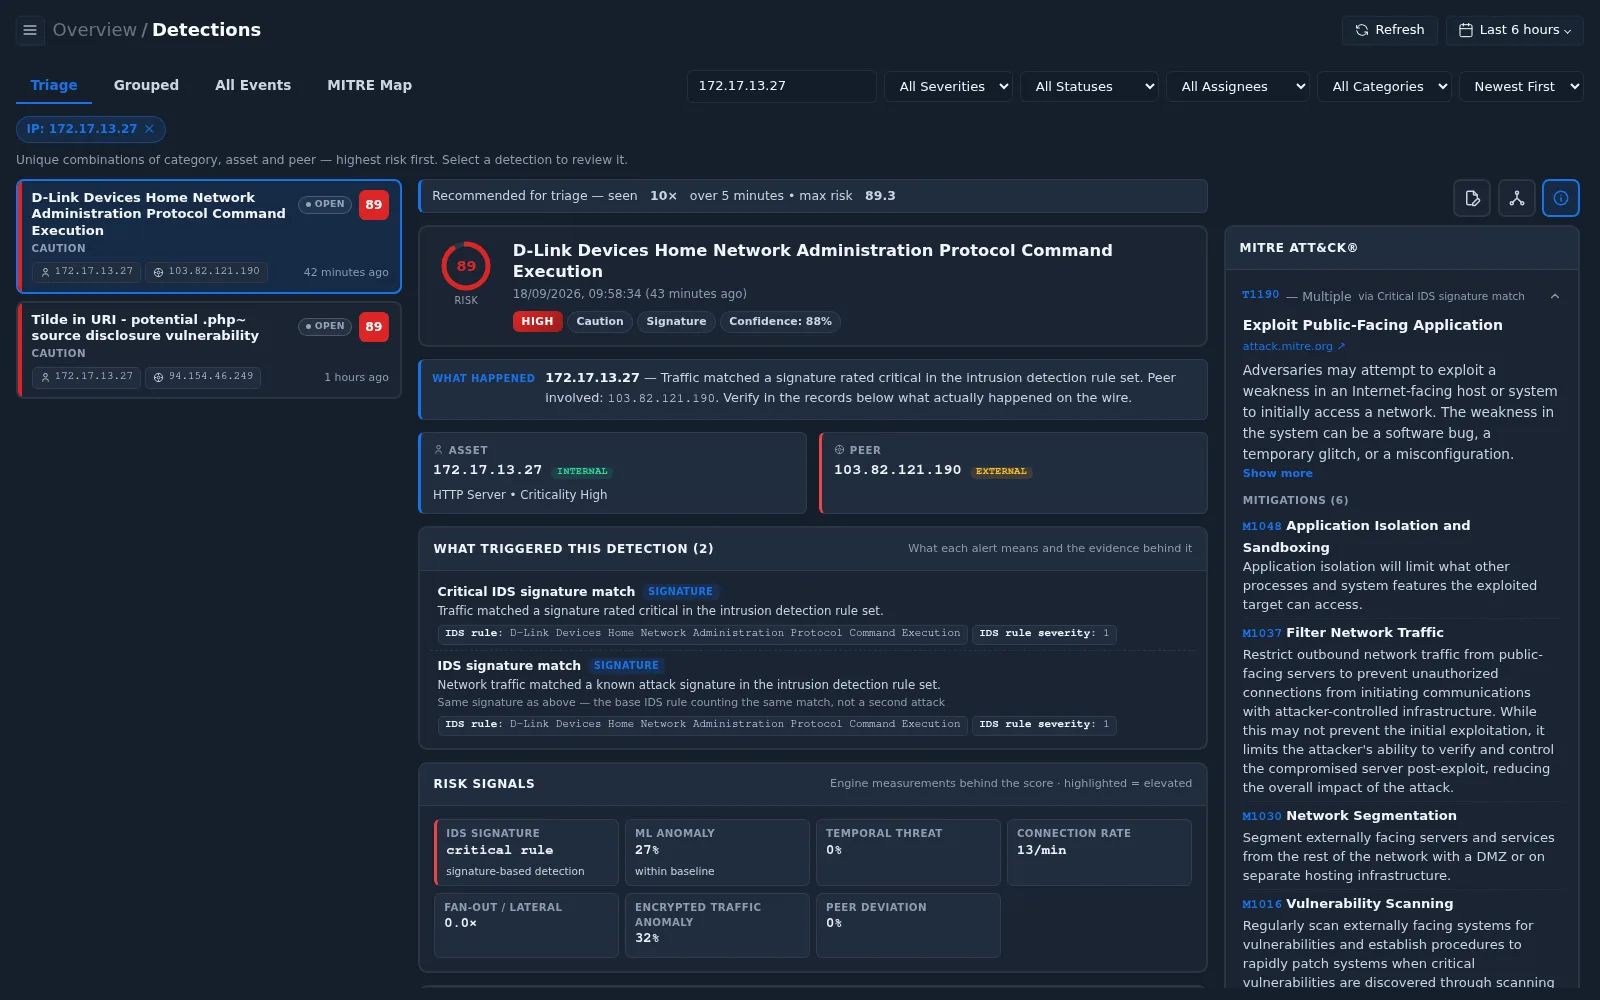
Triage now shows only detections for
172.17.13.27 (the IP filter chip). Each item is a unique combination of
category, asset, and peer, sorted by risk.
| Detection | Peer (external) | Risk | Status |
|---|---|---|---|
| D-Link Devices Home Network Administration Protocol Command Execution | 103.82.121.190 | 89 | OPEN |
| Tilde in URI - potential .php~ source disclosure vulnerability | 94.154.46.249 | 89 | OPEN |
The summary bar gives a first impression, for example Recommended for triage — seen 10× over 5 minutes • max risk 89.3. Review each detection in turn, starting with the highest risk.
Step 4 — Understand what was detected
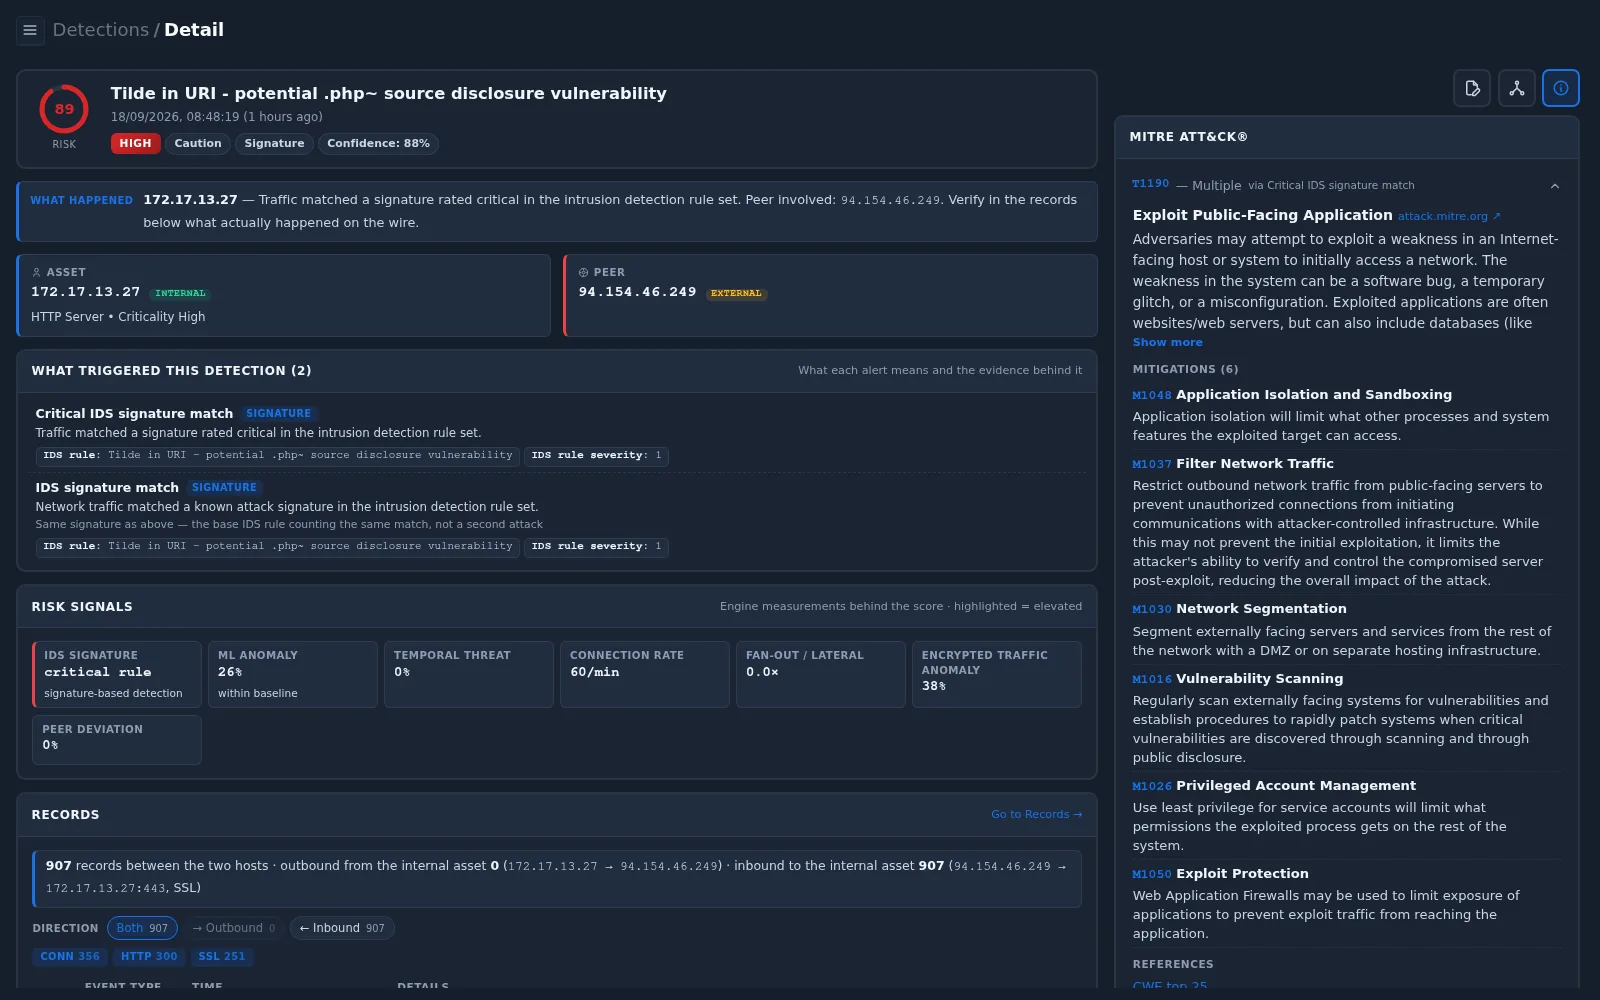
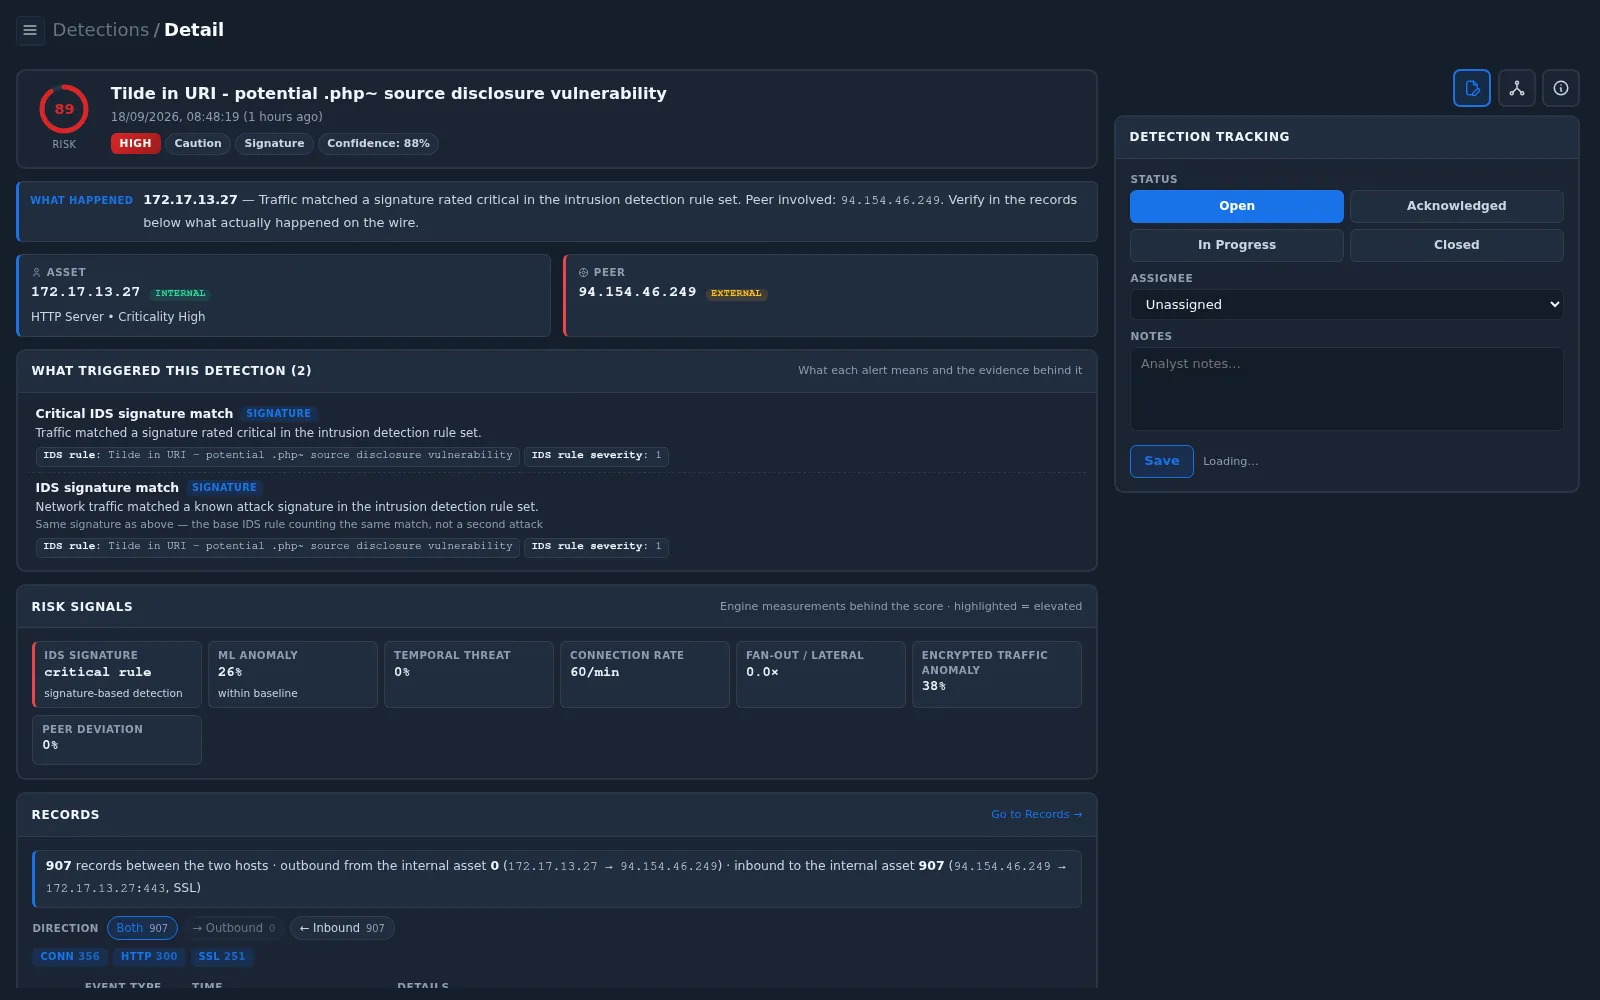
Open a detection and read the top of the page from left to right.
| Section | What to read |
|---|---|
| Header | Risk 89, severity HIGH, category Caution, method Signature, confidence 88% |
| What Happened | Traffic matched a signature rated critical in the intrusion detection rule set, and which peer was involved |
| What Triggered This Detection | The IDS rule name and its severity (IDS rule severity: 1). The second alert is the same match counted by the base rule — not a second attack |
| Risk Signals | Only IDS Signature is elevated. ML anomaly is within baseline, fan-out is 0.0× — no sign of the host spreading to other systems |
| MITRE ATT&CK | T1190 Exploit Public-Facing Application — an attempt to exploit an internet-facing service |
What each signature means:
| Detection | Meaning of the signature |
|---|---|
| D-Link … Command Execution | A request that tries to run commands through the management interface of D-Link home network devices |
| Tilde in URI - .php~ source disclosure | Requests for backup files (for example index.php~) that could expose application source code or secrets |
Step 5 — Analyze the participants
Open the Participant & History panel (middle icon at the top right).
Asset
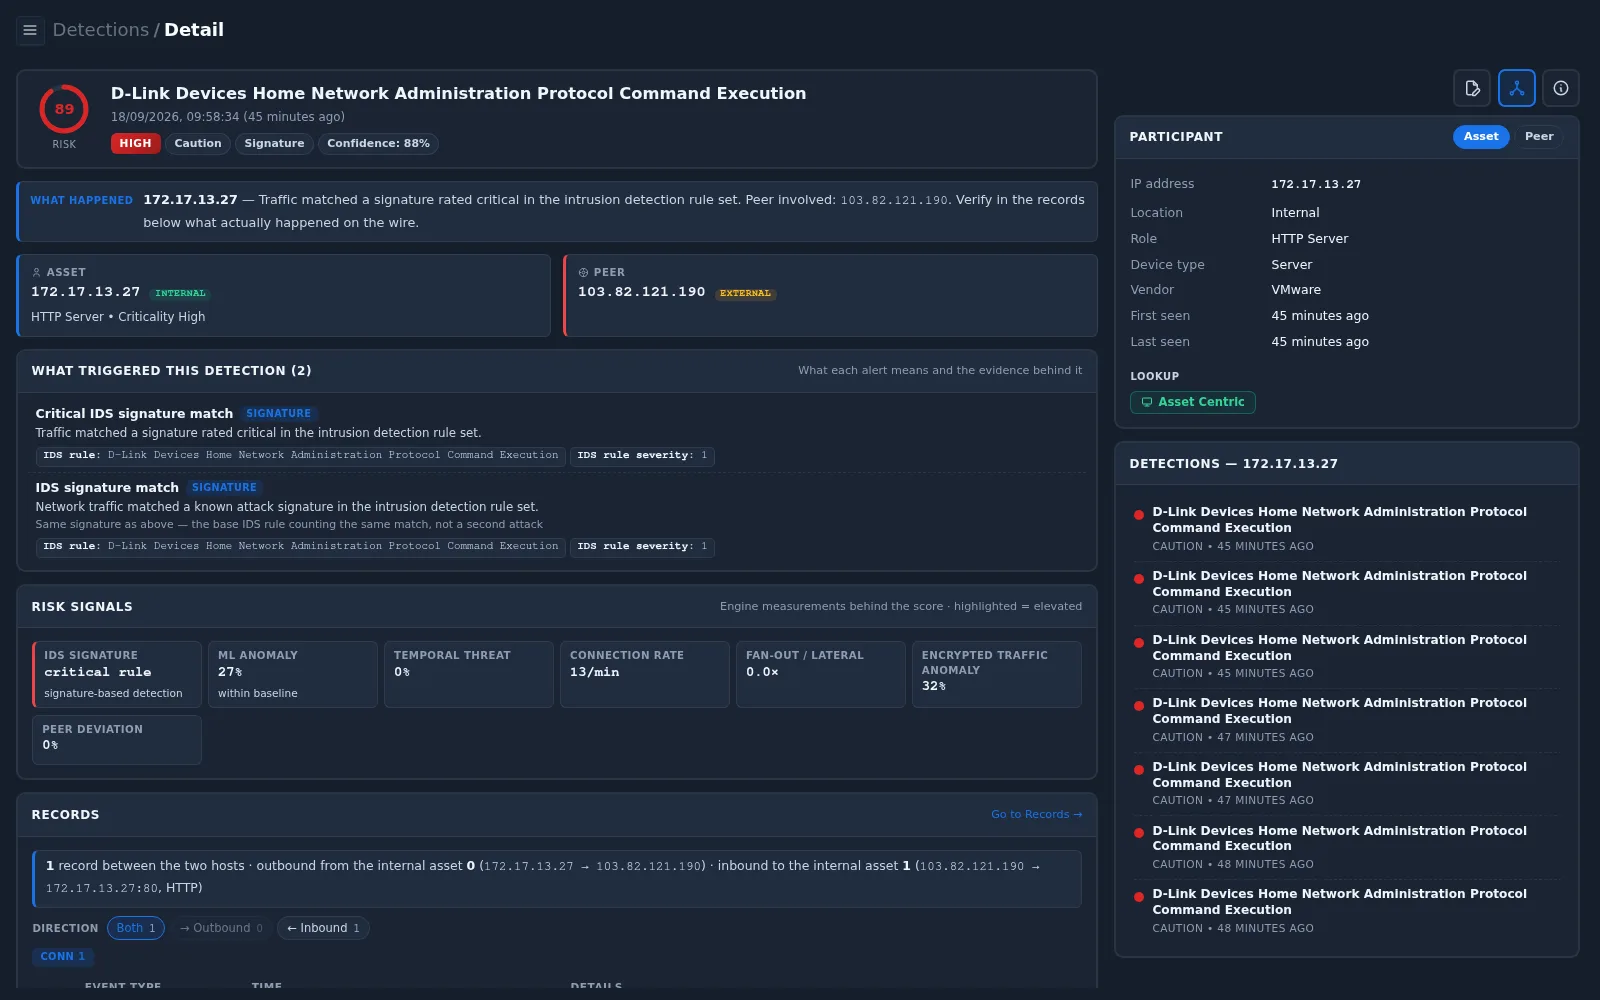
| Field | Value | Interpretation |
|---|---|---|
| Location | Internal | The target is inside your network |
| Role | HTTP Server | It serves web traffic — consistent with being reachable from the internet |
| Device type / vendor | Server / VMware | A virtual server, not a D-Link device |
The Detections — 172.17.13.27 list shows the other detections for this host in the selected range. Here, the D-Link signature appears several times within a few minutes — a burst of the same attempt, not a variety of attacks. Select Asset Centric to open the full asset profile if you need the host's normal traffic for comparison.
Peer
Switch the panel to Peer.
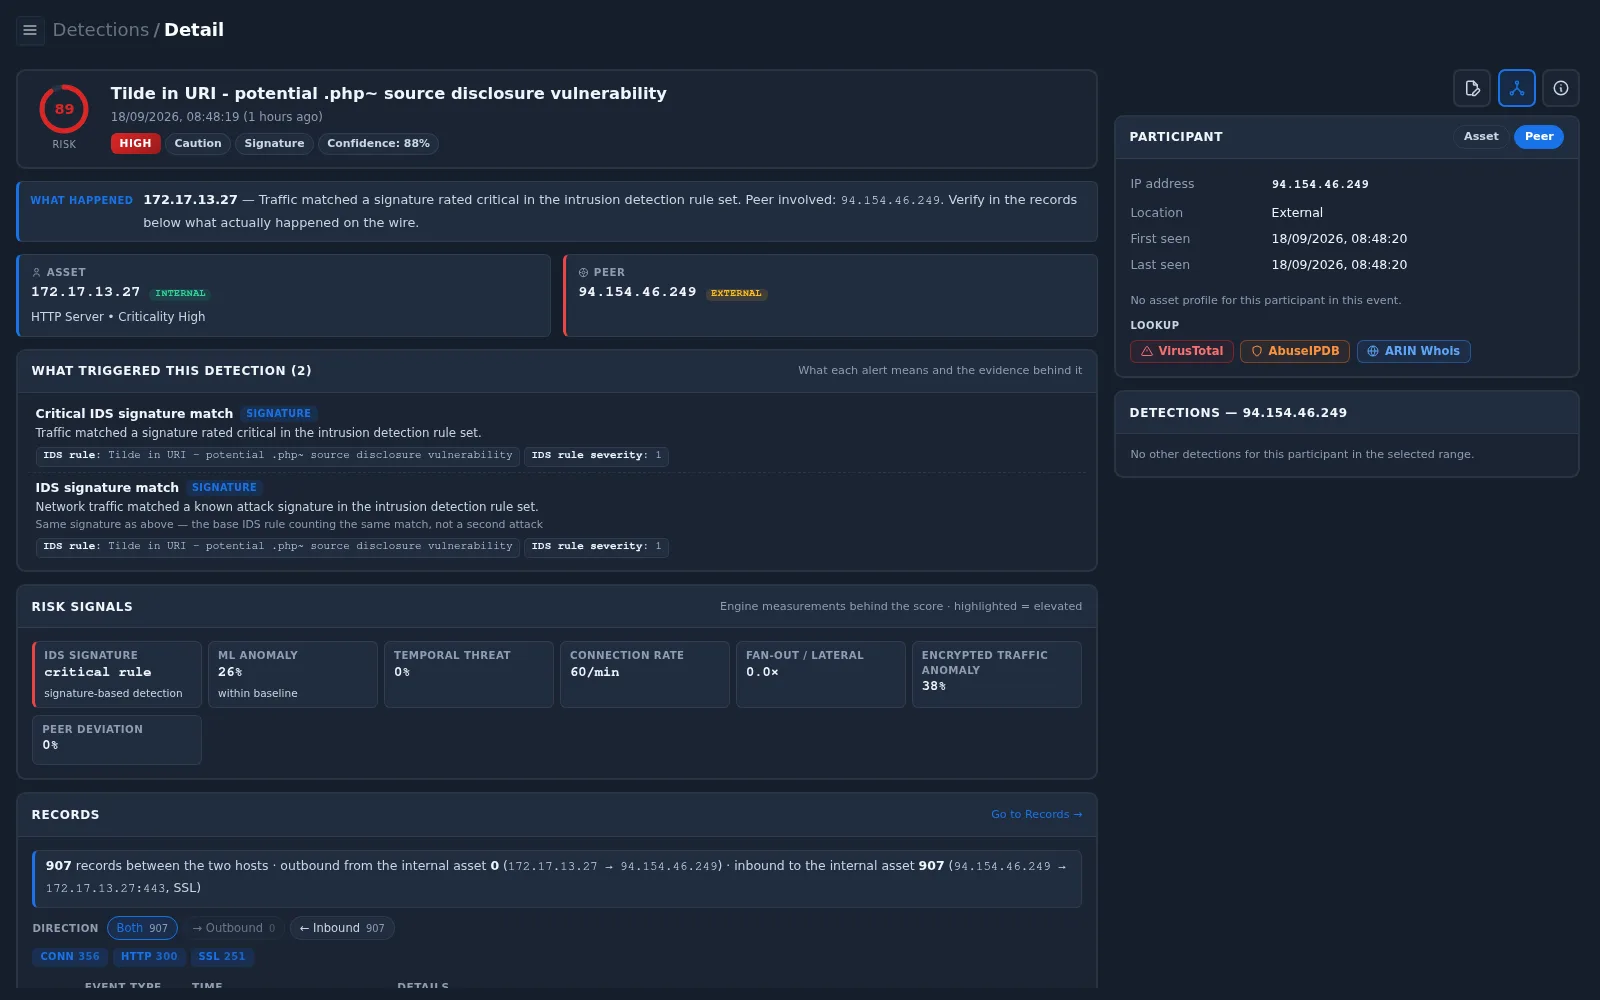
- The peer is External and has no asset profile — it is not one of your systems.
- Use Lookup › VirusTotal, AbuseIPDB, or ARIN Whois to check the reputation and owner of the address. Scanners and known malicious hosts are usually reported there.
- Detections — peer IP shows whether the same peer triggered detections against other internal hosts. If it did, the activity is broader than one server. In this example it shows No other detections for this participant in the selected range.
Verify the peer with third-party sources
SentriaOne xSIEM shows what the peer did in your network. Third-party reputation services show what the same address has done elsewhere on the internet. Checking them confirms whether the peer is a known malicious source, and gives independent evidence for your decision.
Select VirusTotal or AbuseIPDB under Lookup. The service opens in a new browser tab with the peer address already filled in.
VirusTotal
VirusTotal combines the verdicts of many security vendors and threat intelligence feeds for the same IP address.
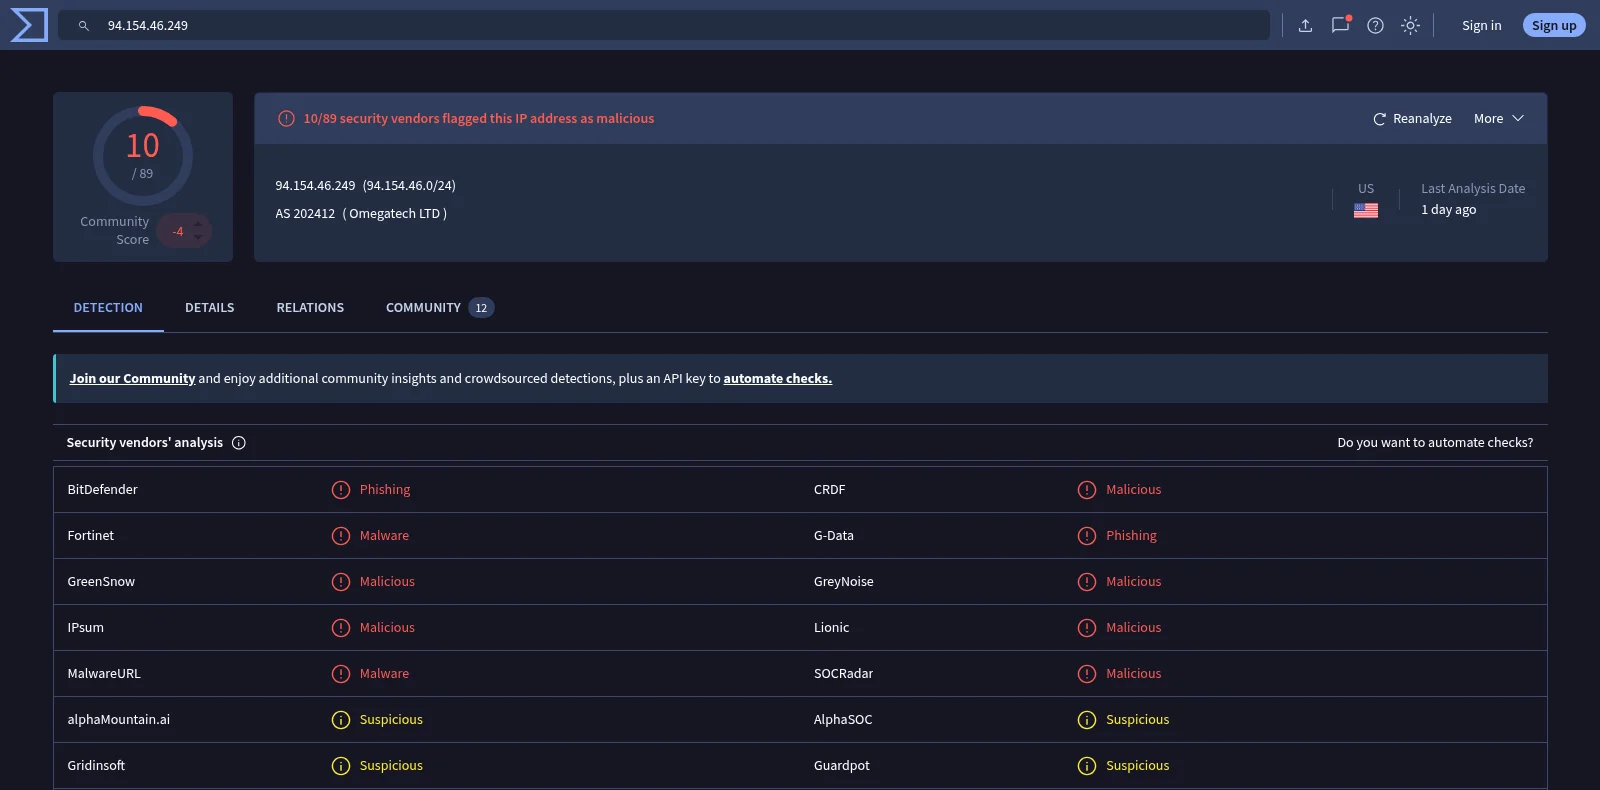
| Field | Example for 94.154.46.249 | Meaning |
|---|---|---|
| Detection score | 10 / 89 security vendors flagged it as malicious | 10 of 89 vendors list the address as malicious. Any non-zero score deserves attention; several independent vendors make it credible |
| Vendor verdicts | Malicious, Malware, Phishing (for example GreyNoise, Fortinet, BitDefender); some Suspicious; the rest Clean | The kind of activity each vendor has associated with the address. Clean only means that vendor has no record of it — it does not outweigh the malicious verdicts |
| Community score | -4 | Votes from VirusTotal users. A negative score means users consider it harmful |
| Network / AS | 94.154.46.0/24, AS202412 (Omegatech LTD) | The network block and the organization that announces it |
| Last Analysis Date | 1 day ago | When the vendor verdicts were last refreshed. Use Reanalyze for a current result |
AbuseIPDB
AbuseIPDB collects reports of abusive behaviour — such as scanning, brute force, and web attacks — submitted by administrators around the world.
| Field | Example for 94.154.46.249 | Meaning |
|---|---|---|
| Reports | Reported 901 times | Many independent organizations have seen abuse from this address |
| Confidence of Abuse | 100% | AbuseIPDB's estimate (0–100%) that the address is currently abusive, based on recent reports |
| Usage Type | Data Center / Web Hosting / Transit | A hosting or server address — not a home user or office. Automated scanners commonly run from such networks |
| ISP / Domain / ASN | Omegatech LTD, omegatech.sc, AS202412 | The provider responsible for the address — useful for an abuse report |
| Country / City | Netherlands, Kerkrade | Estimated location of the address |
ARIN Whois
ARIN Whois shows the registration record of the address: the organization that holds the network block and its contacts. For addresses registered in other regions, the result refers to the responsible regional registry.
Interpreting the results
| Result | Interpretation |
|---|---|
| High AbuseIPDB confidence, several VirusTotal detections, hosting network | Known malicious or scanning infrastructure — supports blocking the address |
| No reports and no detections | Not known as malicious. Rely on the evidence in your own records |
| Few detections on a shared network (for example a large cloud or CDN provider) | Possible false positive — many unrelated users can share such addresses |
In this example both sources agree: 94.154.46.249 is a hosting address with
100% abuse confidence, 901 reports, and 10 vendor detections. This confirms
that the traffic seen in SentriaOne xSIEM came from known malicious scanning
infrastructure.
- Reputation data is a point-in-time view. Addresses change owners, and reports age out. Record the date you checked.
- Sources may disagree on details such as location. In this example VirusTotal shows US while AbuseIPDB shows Netherlands; geolocation databases differ, so do not base a decision on location alone.
- A clean reputation does not prove an address is safe. New attack infrastructure often has no reports yet — the records in SentriaOne xSIEM remain the primary evidence.
- Looking up an address sends it to the third-party service. Only look up external peer addresses, never internal IP addresses or hostnames.
Step 6 — Verify the evidence in the records
The Records section shows what actually crossed the network between the asset and the peer, within ±30 minutes of the detection.
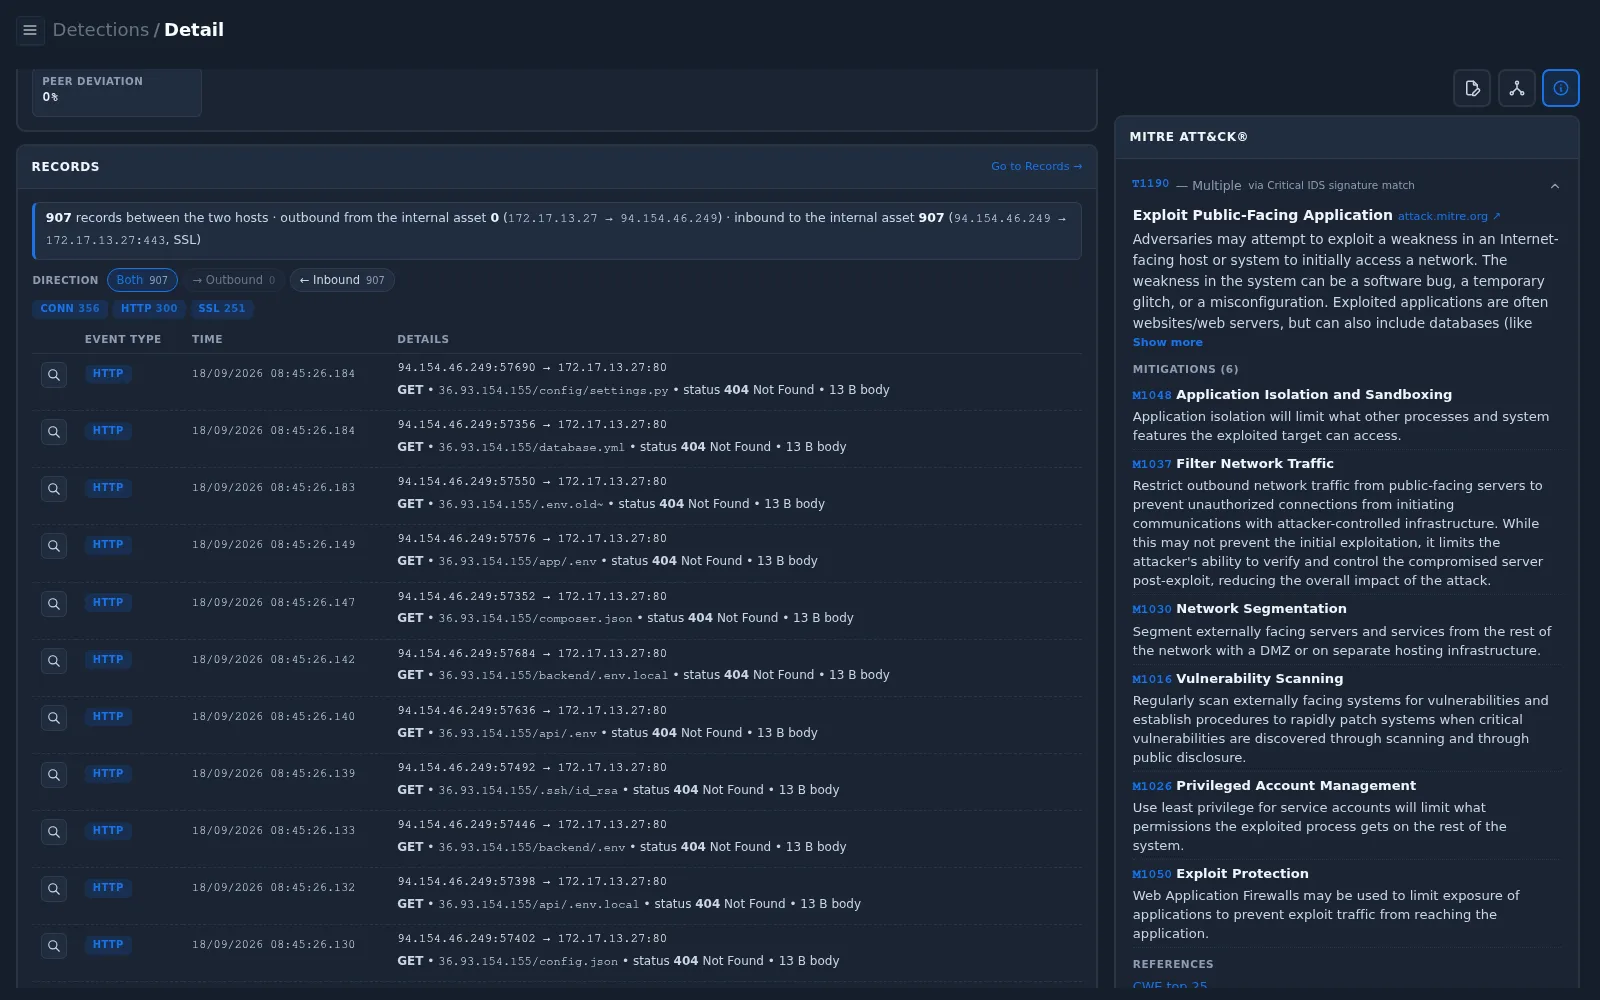
Tilde in URI — evidence
| Observation | Meaning |
|---|---|
| 907 records, Inbound 907, Outbound 0 | All traffic was initiated by the peer. The server never connected back to it |
| Record types CONN 356, HTTP 300, SSL 251 | Many connections in a short time — automated tooling |
HTTP requests for /.env, /.env.old~, /app/.env, /backend/.env.local, /database.yml, /config/settings.py, /composer.json, /.ssh/id_rsa, … | A scan for configuration files, backups, credentials, and keys |
| Every response: status 404 Not Found • 13 B body | None of the requested files existed — nothing was disclosed |
D-Link — evidence
| Observation | Meaning |
|---|---|
| 1 record, Inbound 1, Outbound 0 | A single inbound attempt, no connection back to the peer |
CONN to port 80, 2.2 KB ↑ / 840 B ↓, state SF | One normal HTTP exchange carrying the exploit attempt |
| Asset is a VMware server, not a D-Link device | The exploit targets a product the server does not run |
- Responses other than 404, especially 200 OK with a large body, which could mean a file was actually returned.
- Any Outbound records from the asset to the peer after the attempt, which could indicate a successful exploit calling back.
- Use Go to Records → to search the full time range, not only ±30 minutes.
Step 7 — Decide and act
Summarize the findings before deciding:
| Question | Finding in this example |
|---|---|
| What was detected? | Two exploit/scan signatures against a public web server (T1190) |
| Is the target vulnerable to it? | D-Link exploit: not applicable. Backup-file scan: all requests returned 404 |
| Did the attack succeed? | No evidence — no successful responses and no outbound connections |
| Is the activity spreading? | No — fan-out 0.0×, no other internal hosts involved |
| Is the peer known to be malicious? | Yes — AbuseIPDB 100% confidence (901 reports), VirusTotal 10/89 vendors |
| Conclusion | Unsuccessful automated internet scanning of an exposed web server |
Possible actions, guided by the MITRE ATT&CK mitigations on the detection:
- Block the peer addresses at the perimeter firewall or web application firewall (M1037 Filter Network Traffic, M1050 Exploit Protection).
- Confirm that the server is intended to be reachable from the internet, and that no backup or configuration files are stored in the web root.
- Include the server in regular vulnerability scanning (M1016 Vulnerability Scanning).
- If the evidence had shown a 200 response or outbound callback, treat it as a possible compromise and escalate according to your incident response procedure.
See Incident Response for the general decision process.
Step 8 — Record the outcome in Detection Tracking
Open the Detection Tracking panel (left icon at the top right) and record the progress for each detection.
| When | Status | Assignee |
|---|---|---|
| You start reviewing the detection | Acknowledged | Assign to yourself |
| Actions (for example blocking) are in progress | In Progress | Owner of the action |
| Analysis and actions are complete | Closed | — |
Write the reasoning in Notes so that others can follow the decision. Example:
Inbound scan from 94.154.46.249 against web server 172.17.13.27.
907 records, all inbound; HTTP requests for .env, backup and key files
(.env.old~, database.yml, .ssh/id_rsa) — all returned 404, 13 B body.
No outbound connections from the server to the peer. No other internal
hosts involved.
Peer reputation (checked 18/09/2026): AbuseIPDB 100% confidence, 901
reports, hosting network (Omegatech LTD, AS202412); VirusTotal 10/89.
Conclusion: unsuccessful automated scan from known malicious source.
Action: peer IP blocked on perimeter firewall; web root checked for
backup files. Status: Closed.
Select Save. The updated status appears in the Security Overview › Detection Tracking panel and can be filtered in Detections.
If the same scan pattern keeps appearing and has been confirmed as harmless, consider a narrowly scoped suppression rule in Detection Tuning.
Checklist
| Step | Question to answer | Where |
|---|---|---|
| 1 | Which internal hosts are affected? | Overview › Affected Internal IPs |
| 2 | Which host has the highest risk and criticality? | Detections › Grouped › By Internal IP |
| 3 | Which detections involve that host? | Detections › Triage |
| 4 | What was detected and what does the signature mean? | Detection detail, MITRE ATT&CK panel |
| 5 | Who are the asset and the peer? Are there other detections? | Participant & History panel |
| 5 | Is the peer known to be malicious elsewhere? | Lookup › VirusTotal, AbuseIPDB, ARIN Whois |
| 6 | What actually happened on the wire? Did it succeed? | Records |
| 7 | What action is needed? | MITRE mitigations, your procedures |
| 8 | Is the decision and progress documented? | Detection Tracking |