How to build a custom dashboard
The built-in dashboards answer general questions. A custom dashboard answers your question — for example "what is happening on the firewall of Building A?", "which domains do our clients resolve?", or "which TLS versions are still in use?".
This guide builds a dashboard from an empty folder to a saved, shareable result.
Menu: Inventory › Dashboards
Step 1 — Create a folder (optional)
Folders group related dashboards, for example per site, per customer, or per team.
Select New Folder at the bottom of the dashboard list, enter a name such as
Firewall Gedung A, and confirm.
Step 2 — Create the dashboard
Select New Dashboard.
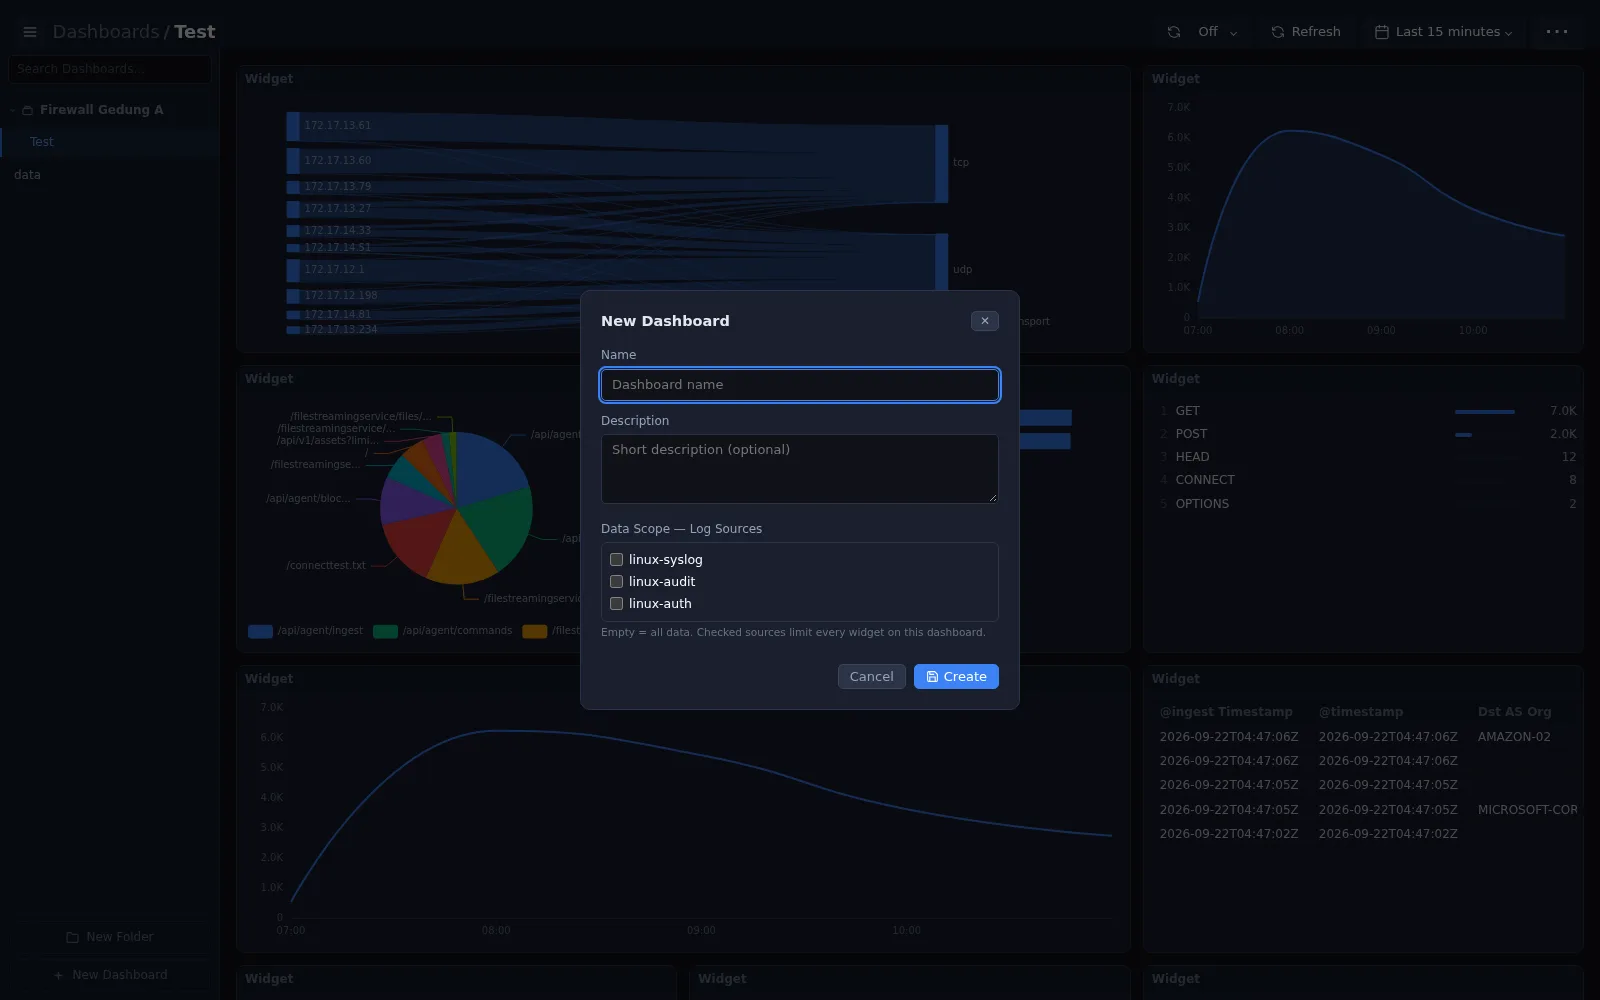
| Field | What to enter |
|---|---|
| Name | A short, specific name, for example DNS Monitoring or Firewall Gedung A |
| Description | Optional — what the dashboard is for and who it is for |
| Data Scope — Log Sources | Optional. Leave empty to use all data. Selecting sources limits every widget on this dashboard to those sources |
Select Create. The empty dashboard opens.
If a dashboard is only about one system — for example a firewall — select that log source once in the data scope instead of repeating the filter in every widget.
Step 3 — Add widgets
Open the ··· menu and select Edit Layout. The header shows EDIT MODE with the buttons Add Widget, Cancel, and Save.
Select Add Widget.
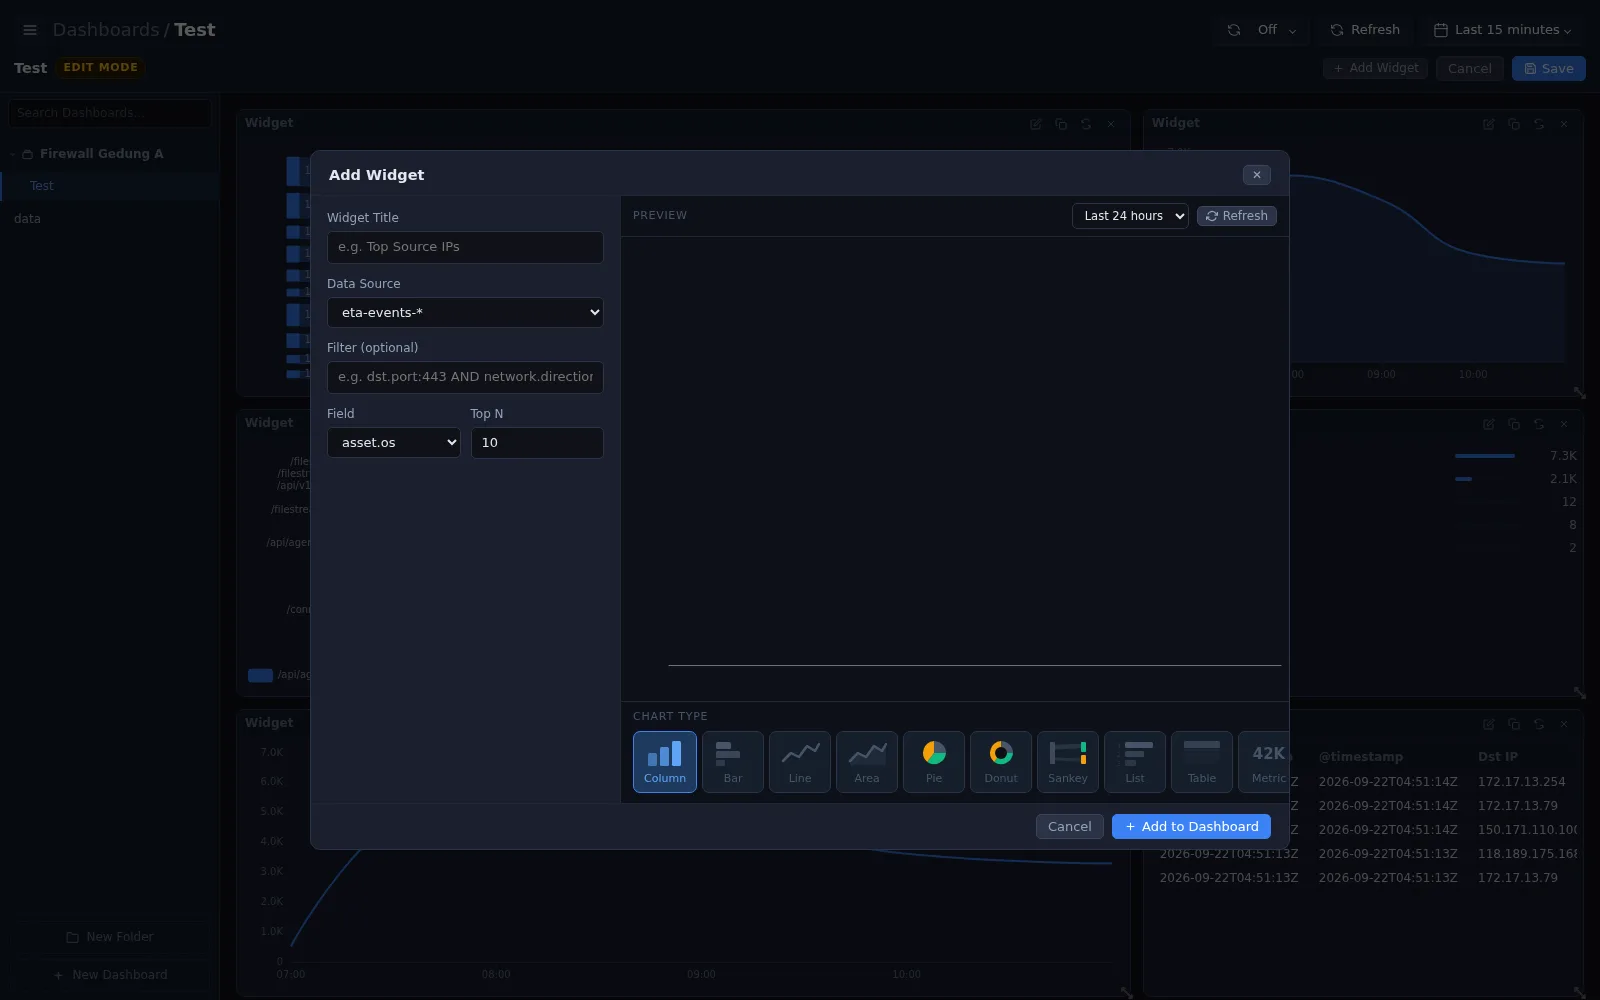
| Setting | What it does |
|---|---|
| Widget Title | The title shown on the dashboard, for example Top Source IPs |
| Data Source | Which data the widget reads (see the table below) |
| Filter (optional) | Narrows the data, using the same syntax as the Records query language, for example dst.port:443 AND network.direction:outbound |
| Field | The field to group by, for example dns.query, src.ip, or ssl.server_name |
| Top N | How many values to show, for example the top 10 |
| PREVIEW | Shows the result before you add it. Choose a preview range (Last 1 hour to Last 30 days) and select Refresh |
| CHART TYPE | How to display the result (see the table below) |
Select Add to Dashboard when the preview looks right, or Cancel to discard the widget.
Data sources
| Data source | Contains |
|---|---|
eta-events-* | Events from the analysis engine (entities, flows, metrics) |
sentriaone-records-conn-* | Network connections |
sentriaone-records-dns-* | DNS queries and responses |
sentriaone-records-http-* | HTTP requests |
sentriaone-records-ssl-* | SSL/TLS sessions |
sentriaone-records-x509-* | Certificates |
sentriaone-records-dhcp-* | DHCP activity |
sentriaone-records-ssh-* | SSH sessions |
sentriaone-records-rdp-* | Remote Desktop activity |
sentriaone-records-kerberos-* | Kerberos authentication |
sentriaone-records-mssql-* | Microsoft SQL Server activity |
sentriaone-records-asset-* | Asset information |
sentriaone-records-software-* | Software observed on assets |
sentriaone-records-notice-* | Notices raised by traffic analysis |
The Field list adapts to the selected data source — for example dns.query,
dns.rcode, and dns.qtype for DNS, or ssl.sni, ssl.ja3, and
ssl.protocol_version for TLS.
Chart types
| Chart type | Use it for |
|---|---|
| Column / Bar | Comparing values, for example the top 10 domains or source IPs |
| Line / Area | A value over time, for example requests per hour |
| Pie / Donut | Shares of a whole, for example response codes or TLS versions |
| Sankey | Flows between two sides, for example hosts to protocols |
| List | A ranked list with counts, compact and easy to read |
| Table | Raw rows with several fields |
| Metric | A single number, for example the total number of events |
| Gauge | A single number against a range |
Step 4 — Arrange the layout and save
While EDIT MODE is active:
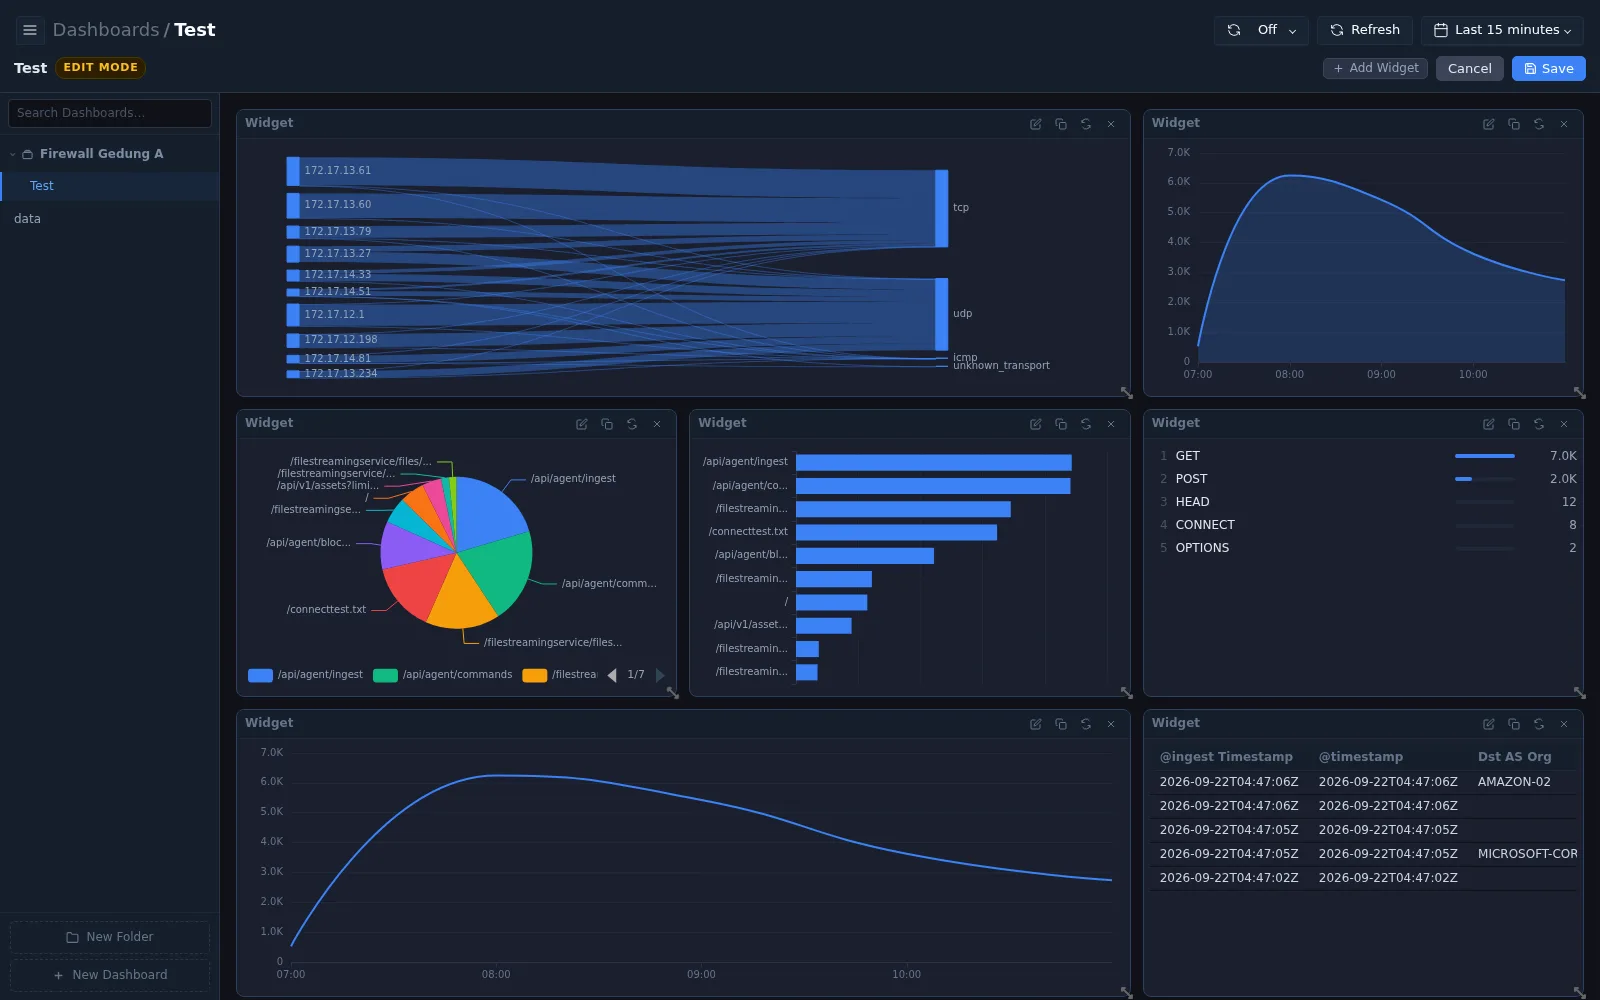
- Drag a widget by its header to move it.
- Resize it from the corner handle.
- Use the icons on each widget to edit, duplicate, refresh, or remove it.
- Select Save to keep the layout, or Cancel to discard all changes made since entering edit mode.
Step 5 — Use and share the dashboard
Outside edit mode, the dashboard uses the same controls as every other page: time range and auto refresh.
The ··· menu contains the dashboard actions.
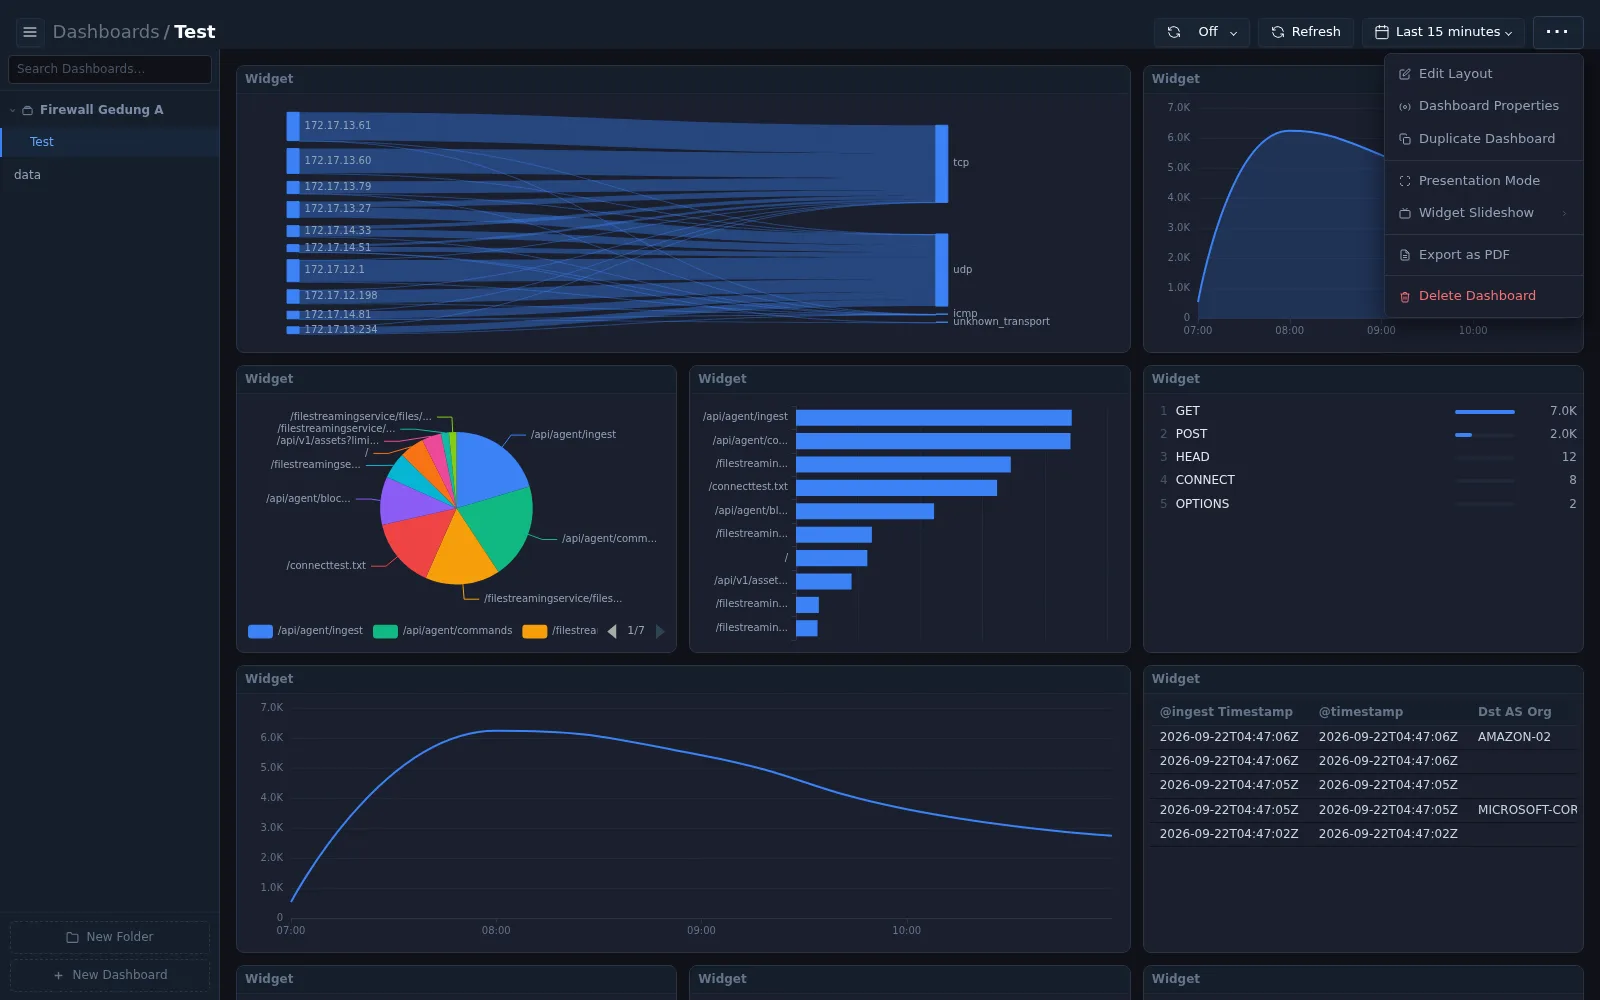
| Action | What it does |
|---|---|
| Edit Layout | Enter edit mode to add, move, resize, or remove widgets |
| Dashboard Properties | Change the name, description, and data scope |
| Duplicate Dashboard | Copy the dashboard — useful as a template for another site or customer |
| Presentation Mode | Full-screen display, for a wall screen in the SOC or NOC |
| Widget Slideshow | Cycle through the widgets automatically |
| Export as PDF | Export the current view, for example to attach to a report |
| Delete Dashboard | Remove the dashboard permanently |
Example — a DNS monitoring dashboard
Four widgets that together answer "what is our DNS doing?":
| # | Widget title | Data source | Filter | Field | Top N | Chart type |
|---|---|---|---|---|---|---|
| 1 | Top Queried Domains | sentriaone-records-dns-* | — | dns.query | 10 | Bar |
| 2 | Response Codes | sentriaone-records-dns-* | — | dns.rcode | 5 | Donut |
| 3 | Top DNS Clients | sentriaone-records-dns-* | — | src.ip | 10 | List |
| 4 | Failed Lookups | sentriaone-records-dns-* | dns.rcode:NXDOMAIN | dns.query | 10 | Table |
The same pattern works for other topics:
| Dashboard | Data source | Useful fields |
|---|---|---|
| TLS hygiene | sentriaone-records-ssl-* | ssl.protocol_version, ssl.server_name, ssl.cipher |
| Web activity | sentriaone-records-http-* | http.host, event_type |
| External traffic | sentriaone-records-conn-* | dst.ip, geo.dst.country_code, protocol |
| Asset overview | sentriaone-records-asset-* | asset.os, asset.os_class |
Tips
- One question per dashboard. Several small dashboards are easier to read than one crowded page.
- Name widgets for the reader, not for the field — Top Queried Domains is clearer than dns.query.
- Check the preview with a realistic time range before adding a widget; a field with very many distinct values is usually better as a Table or List than as a Pie chart.
- Duplicate a dashboard instead of rebuilding it for another site, then change the data scope.
- Use Presentation Mode for a wall screen, and Export as PDF for reports.
Checklist
| Step | Question to answer | Where |
|---|---|---|
| 1 | Where does the dashboard belong? | New Folder |
| 2 | What is it called, and which data may it use? | New Dashboard — Name, Data Scope |
| 3 | Which question does each widget answer? | Add Widget — data source, field, chart |
| 4 | Is the layout readable? | Edit Layout — drag, resize, Save |
| 5 | Who needs it, and how is it shared? | ··· menu — Presentation Mode, Export as PDF |
Related pages
- Dashboards — the Dashboards page in the dashboard guide
- Records — explore data before turning it into a widget
- Query Language Reference — filter syntax